1. Get your Credentials
- Log into your OpenObserve instance
- Navigate to Ingestion:
- Click Ingestion in the side navigation
- Select Traces (OpenTelemetry) option
- Copy OTLP Configuration:
- Under the OTLP HTTP section, copy:
- Ingestion HTTP Endpoint
- Ingestion Authorization key (the part after
Basic)
- Example endpoint:
http://127.0.0.1:5080/api/default - Example auth:
Authorization=Basic%20<Ingestion Authorization key>
- Under the OTLP HTTP section, copy:
2. Instrument your application
For Kubernetes deployments with zero-code instrumentation:YOUR_OPENOBSERVE_HTTP_ENDPOINTwith the Ingestion HTTP Endpoint value you copied in Step 1.- Example:
http://openobserve.monitoring.svc.cluster.local:5080/api/default(for in-cluster) - Example:
http://127.0.0.1:5080/api/default(for local development)
- Example:
YOUR_OPENOBSERVE_AUTH_HEADERwith the Ingestion Authorization key value you copied in Step 1.- Example:
Authorization=Basic%20<Ingestion Authorization key>
- Example:
3. Import the pre-built Dashboard
- Log into your OpenObserve Instance
- Navigate to Dashboards:
- Click Dashboards in the side navigation menu
- Click Import on the top right corner
- Import Dashboard:
- Copy the dashboard JSON provided in the accordion below
- Paste the dashboard JSON text directly under the Import Dashboard from JSON section
- Click Import
- Save the dashboard
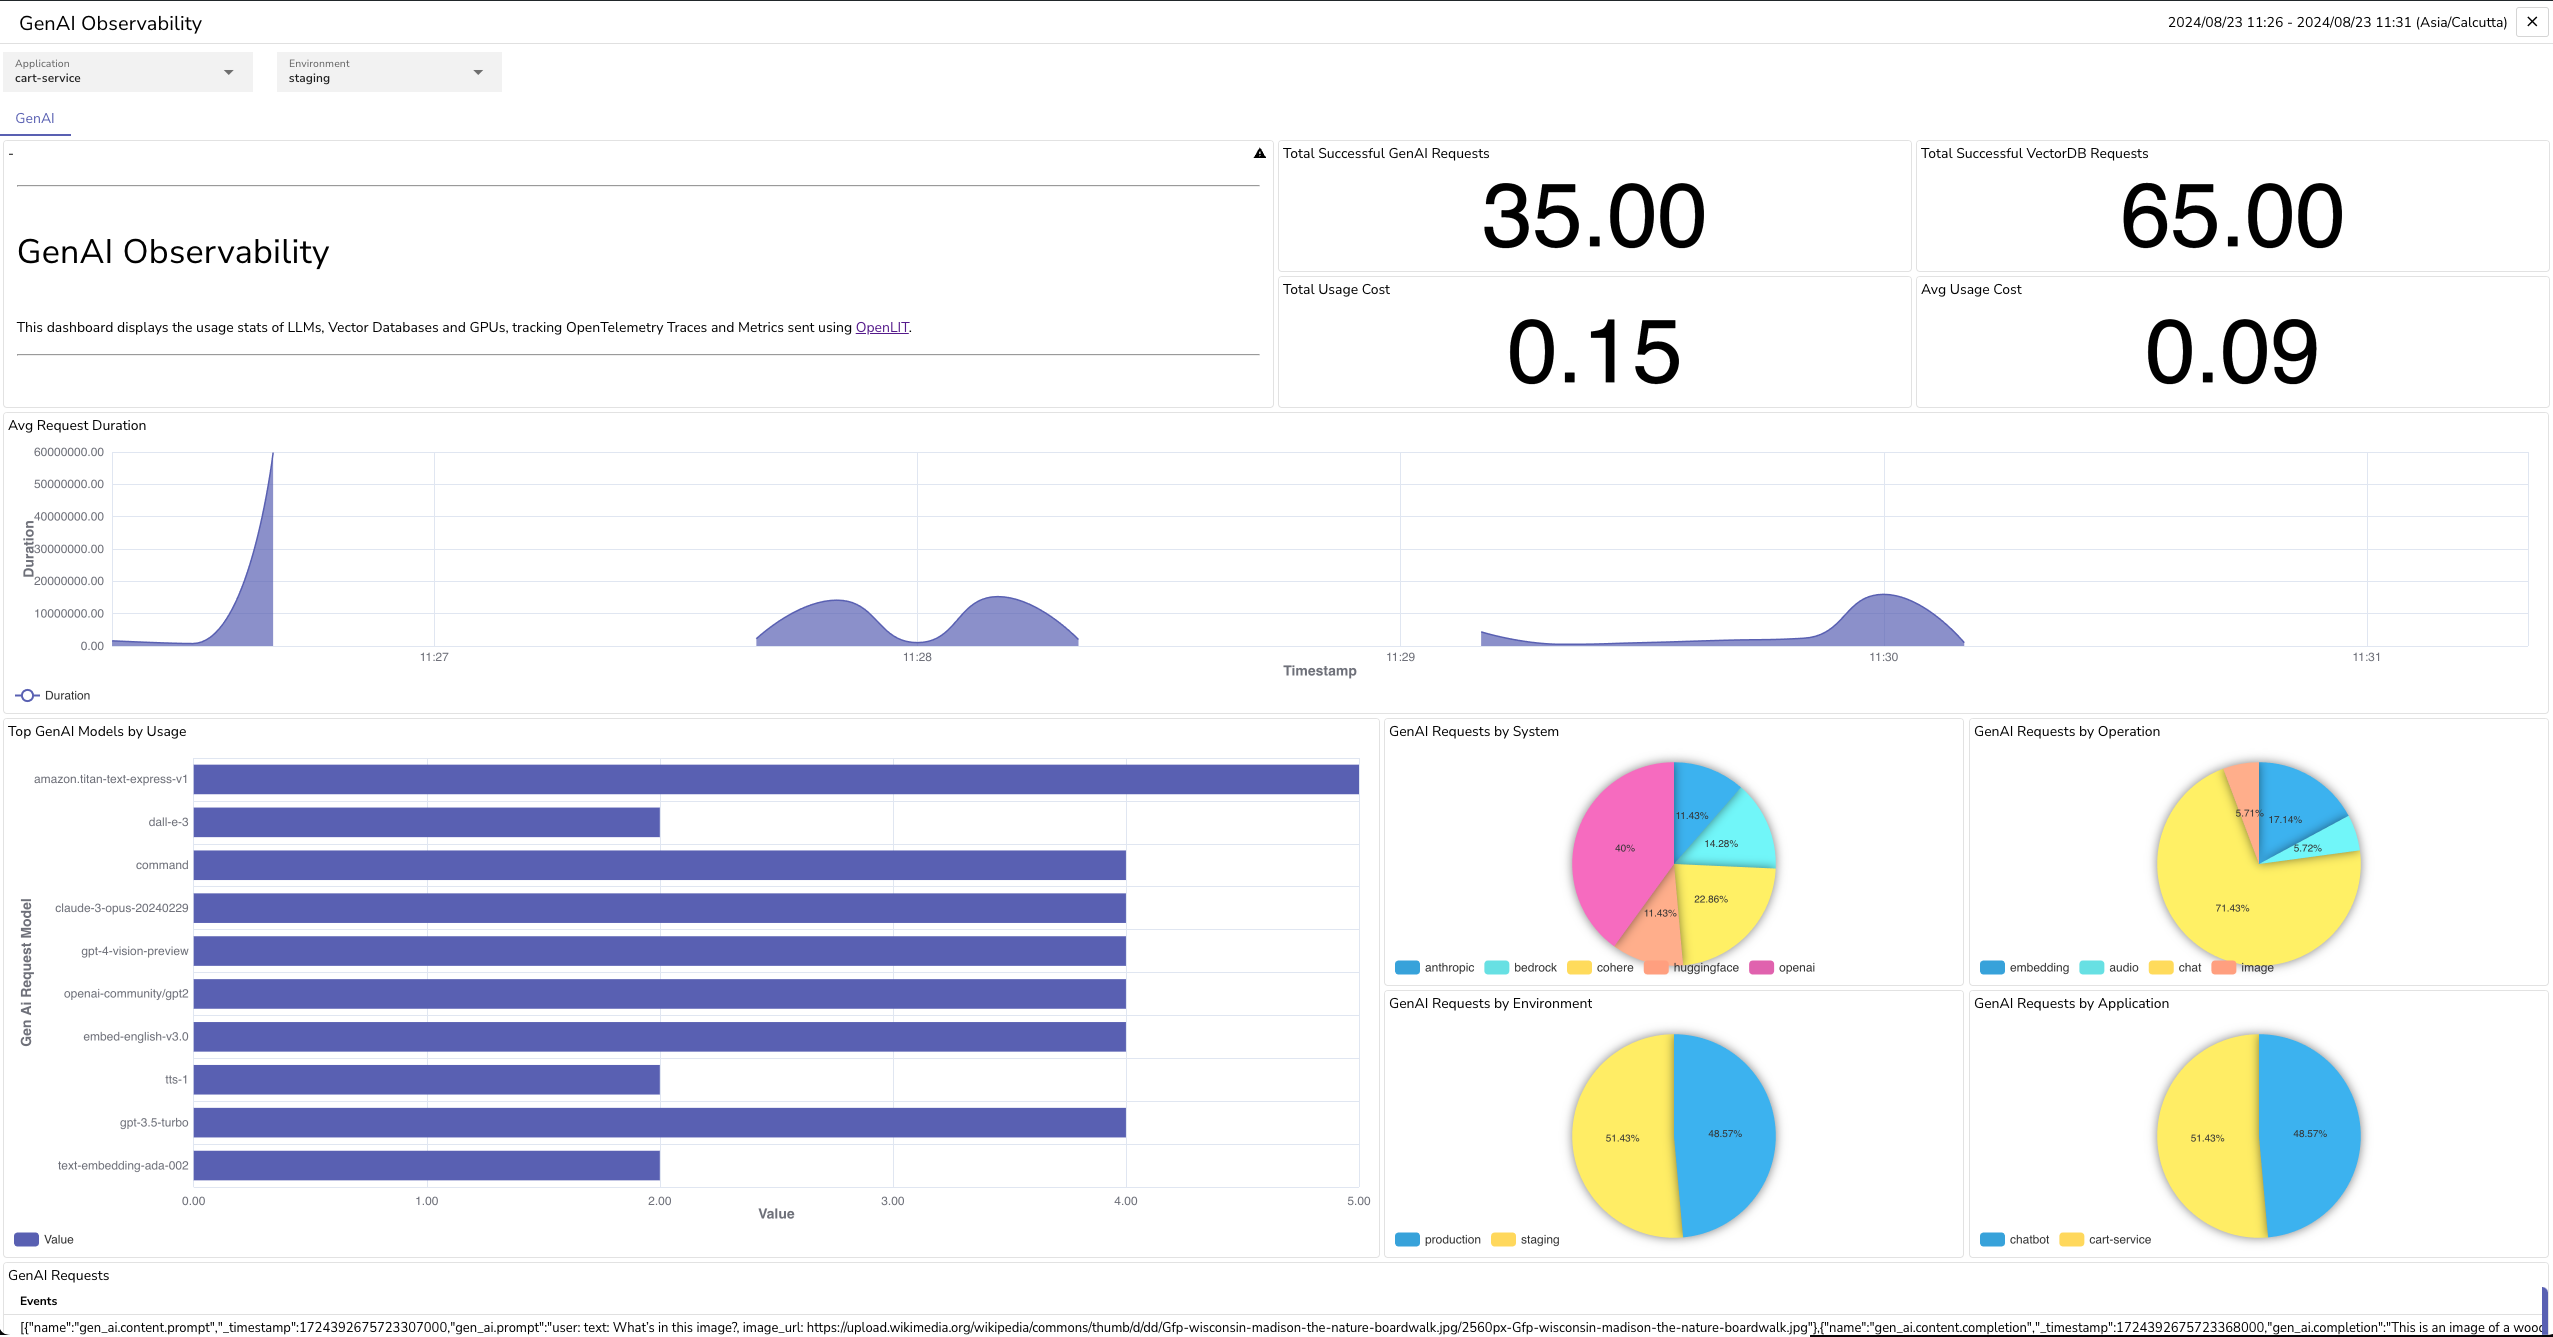
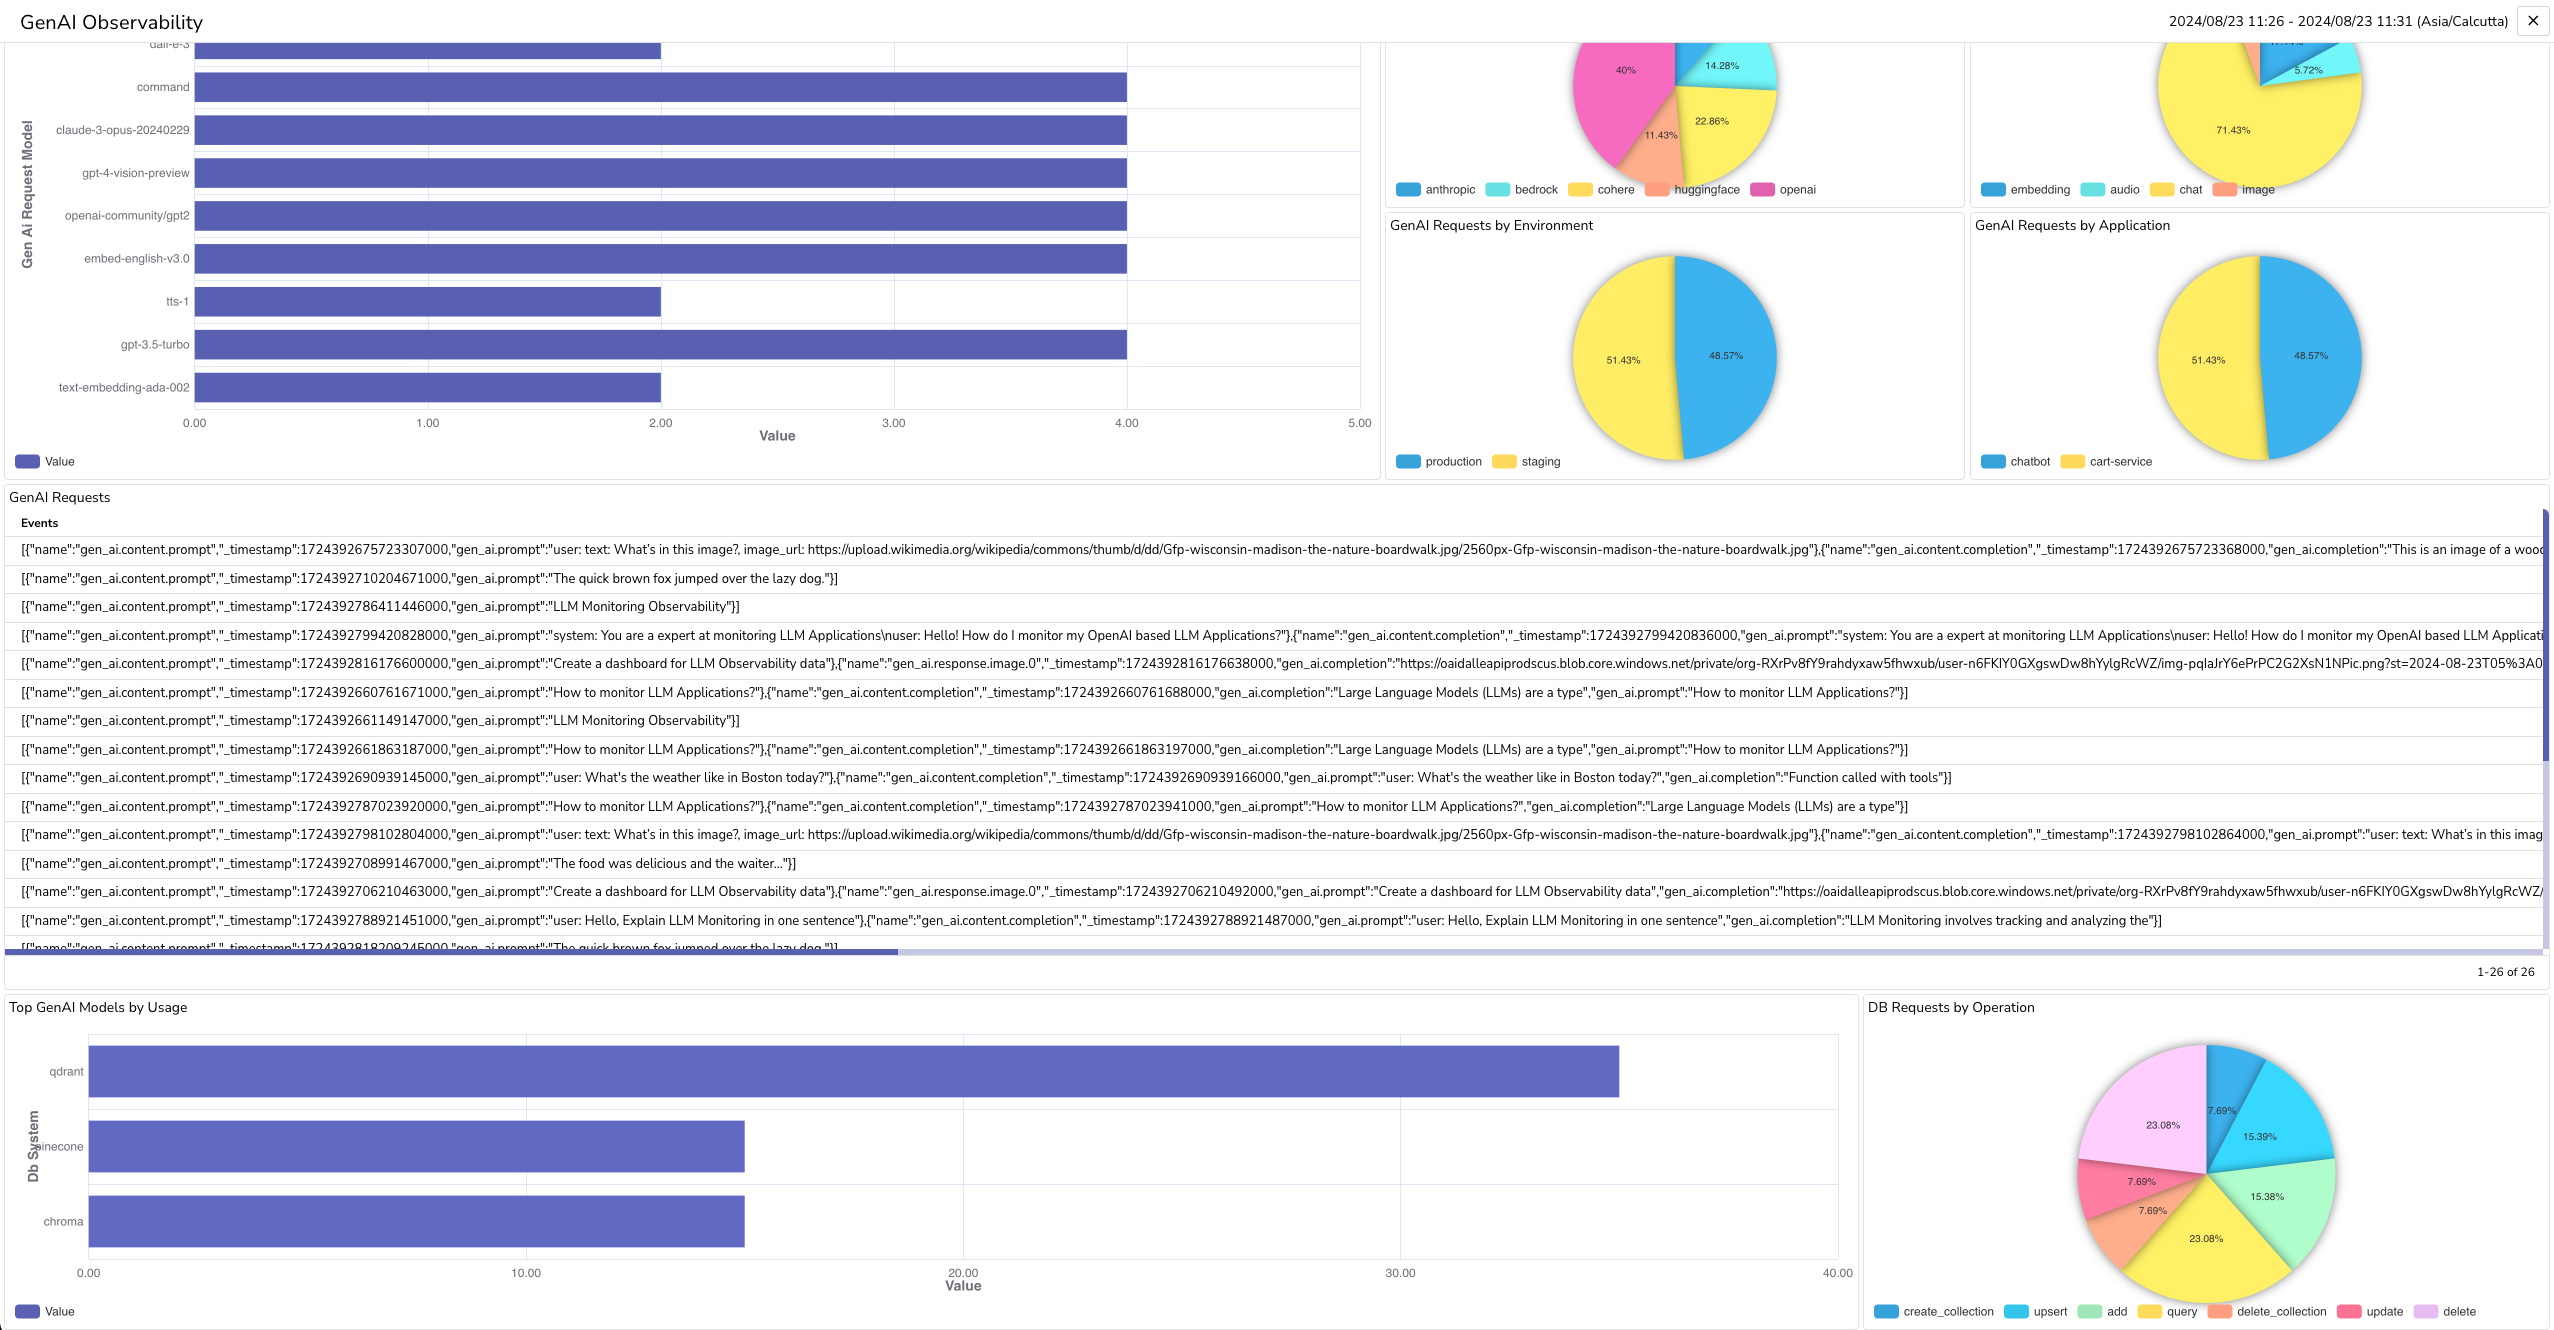
Dashboard
Dashboard