1. Get your Credentials
- Sign in to Grafana Cloud Portal and select your Grafana Cloud Stack.
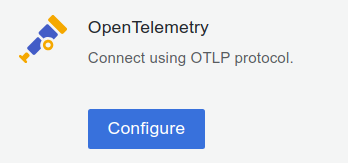
- Click Configure in the OpenTelemetry section.
- In the Password / API Token section, click on Generate now to create a new API token:
- Give the API token a name, for example
openlit - Click on Create token
- Click on Close without copying the token
- Copy and Save the value for
OTEL_EXPORTER_OTLP_ENDPOINTandOTEL_EXPORTER_OTLP_HEADERSReplace the space afterBasicwith%20: OTEL_EXPORTER_OTLP_HEADERS=“Authorization=Basic%20[base64 instanceID:token]”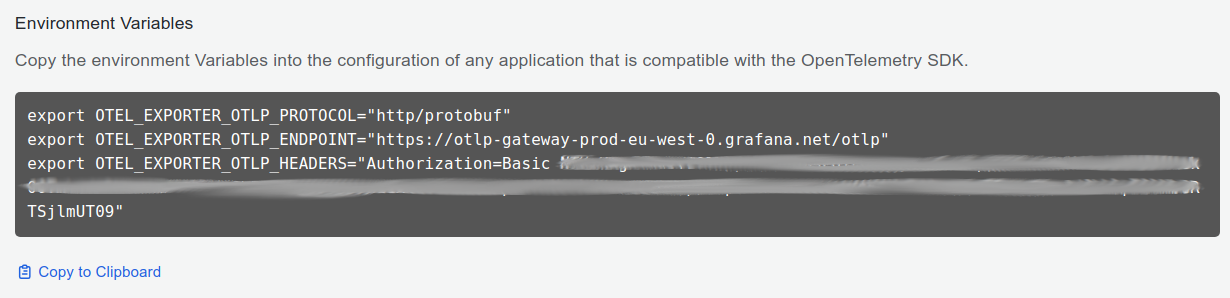
- Give the API token a name, for example
2. Instrument your application
For Kubernetes deployments with zero-code instrumentation:YOUR_GRAFANA_OTEL_GATEWAY_URLwith theOTEL_EXPORTER_OTLP_ENDPOINTvalue you copied in Step 1.- Example:
https://otlp-gateway-<zone>.grafana.net/otlp
- Example:
YOUR_GRAFANA_OTEL_GATEWAY_AUTHwith theOTEL_EXPORTER_OTLP_HEADERSvalue you copied in Step 1.- Example:
Authorization=Basic%20<base64 encoded Instance ID and API Token>
- Example:
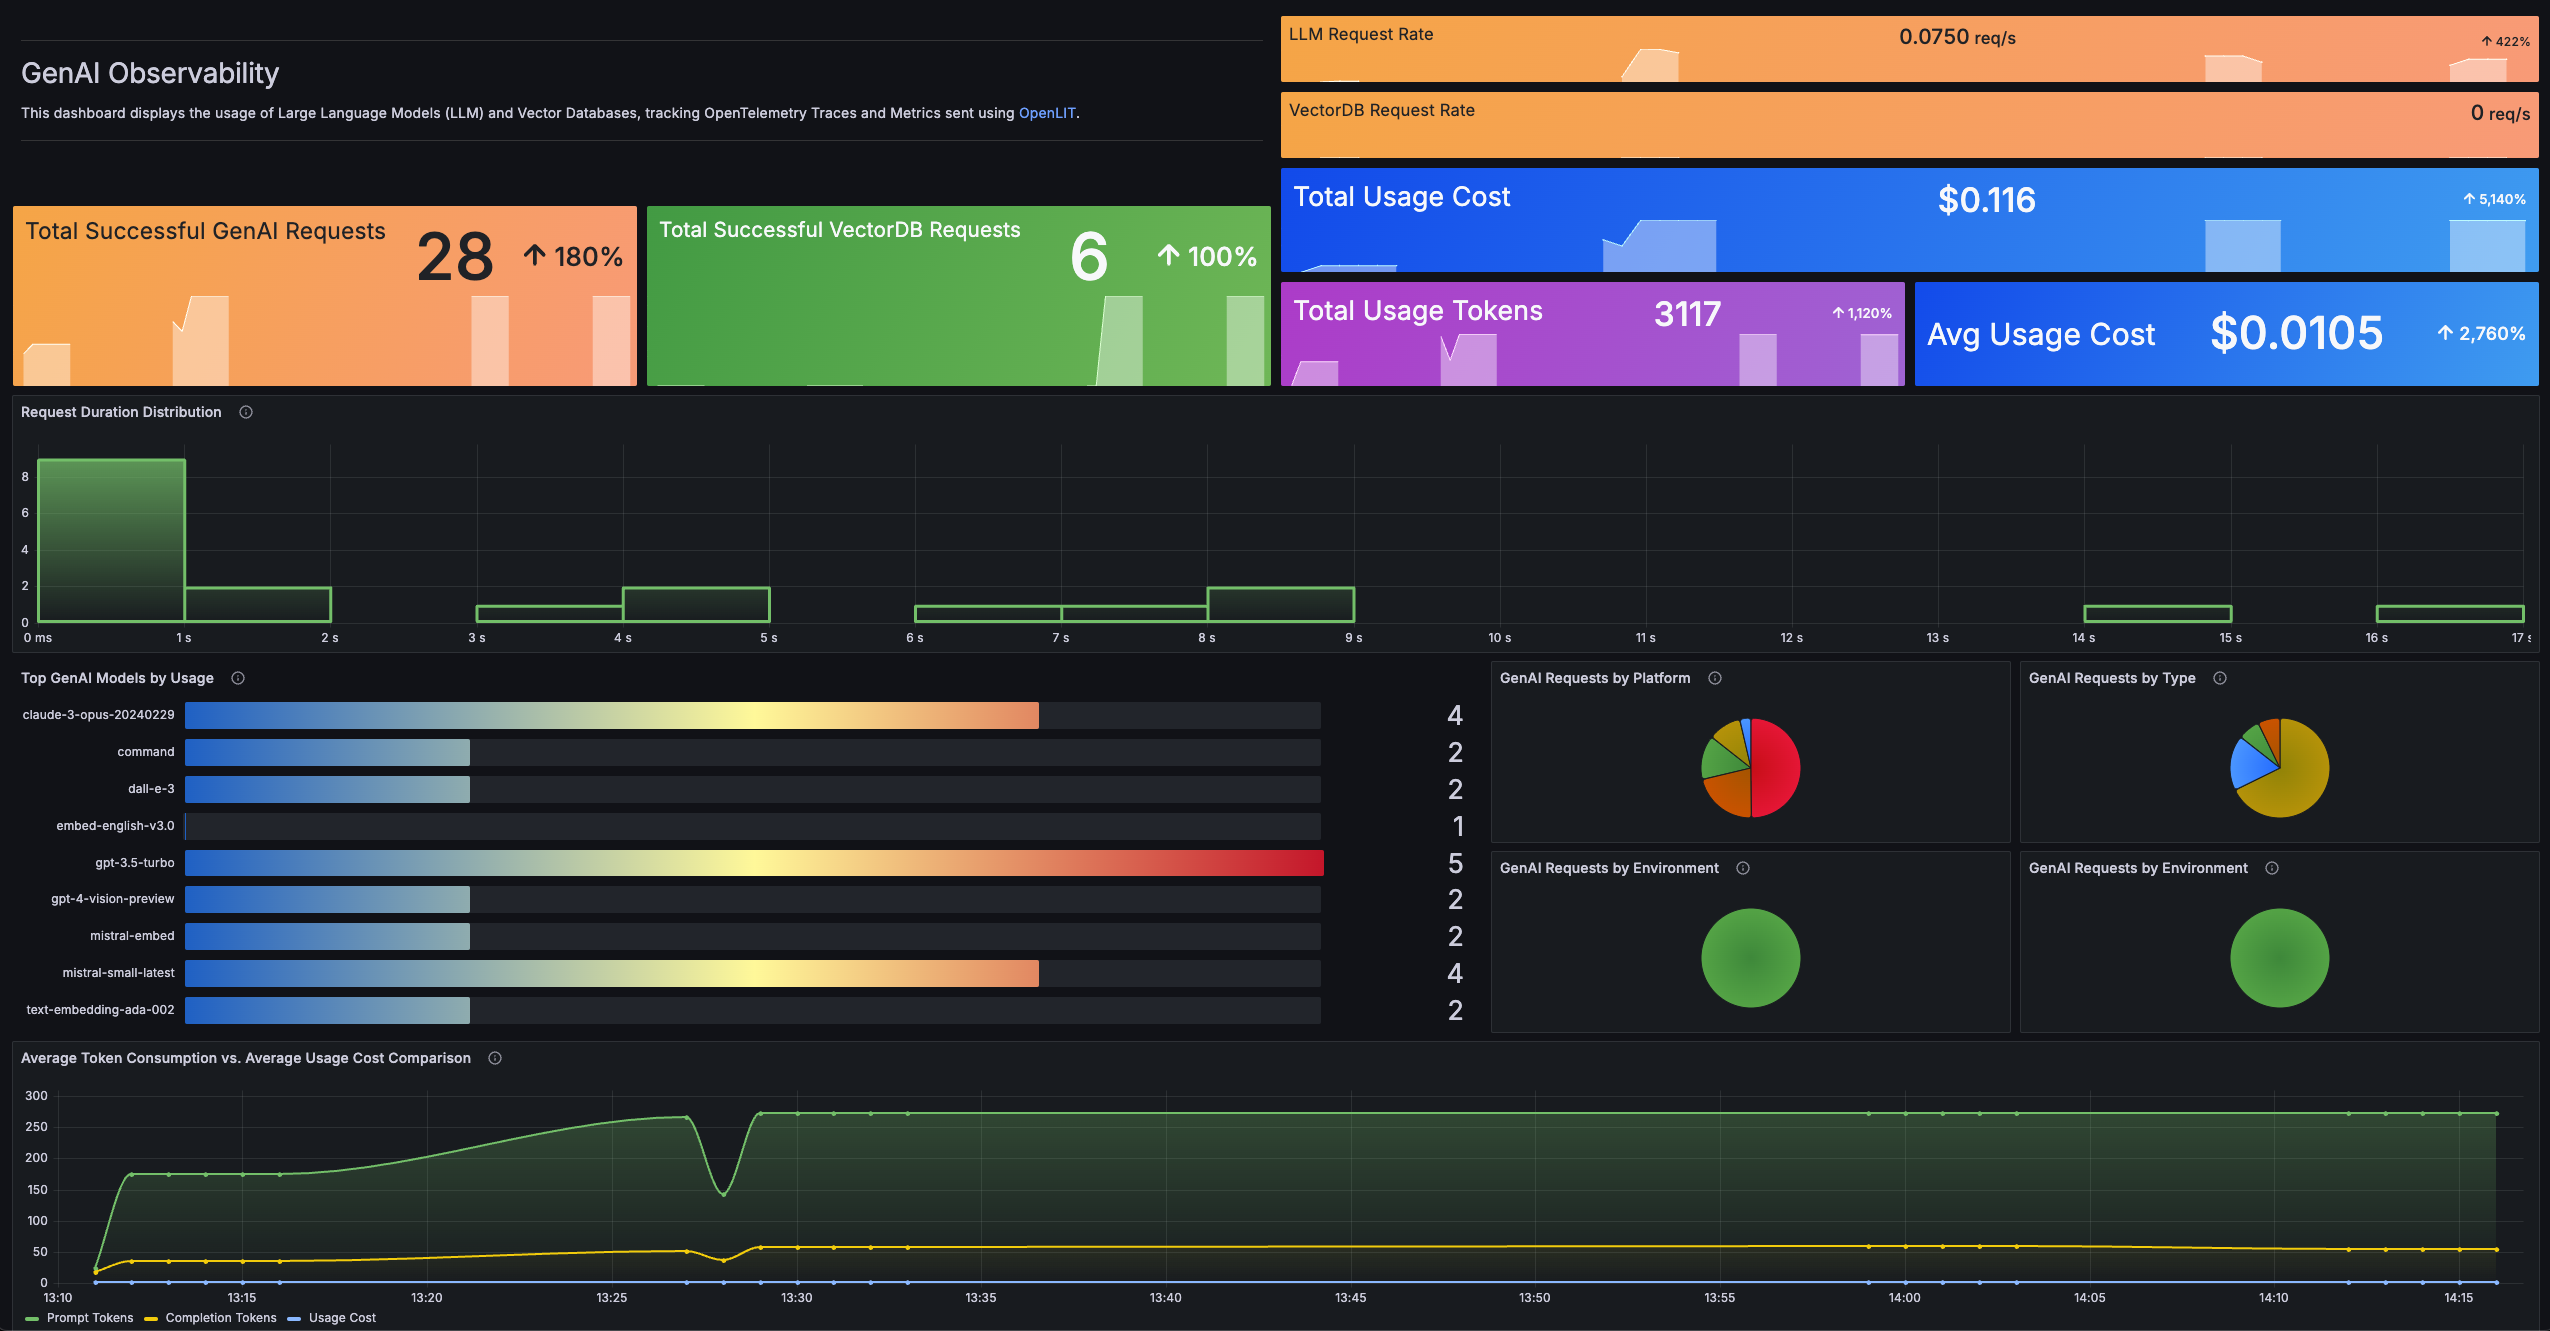
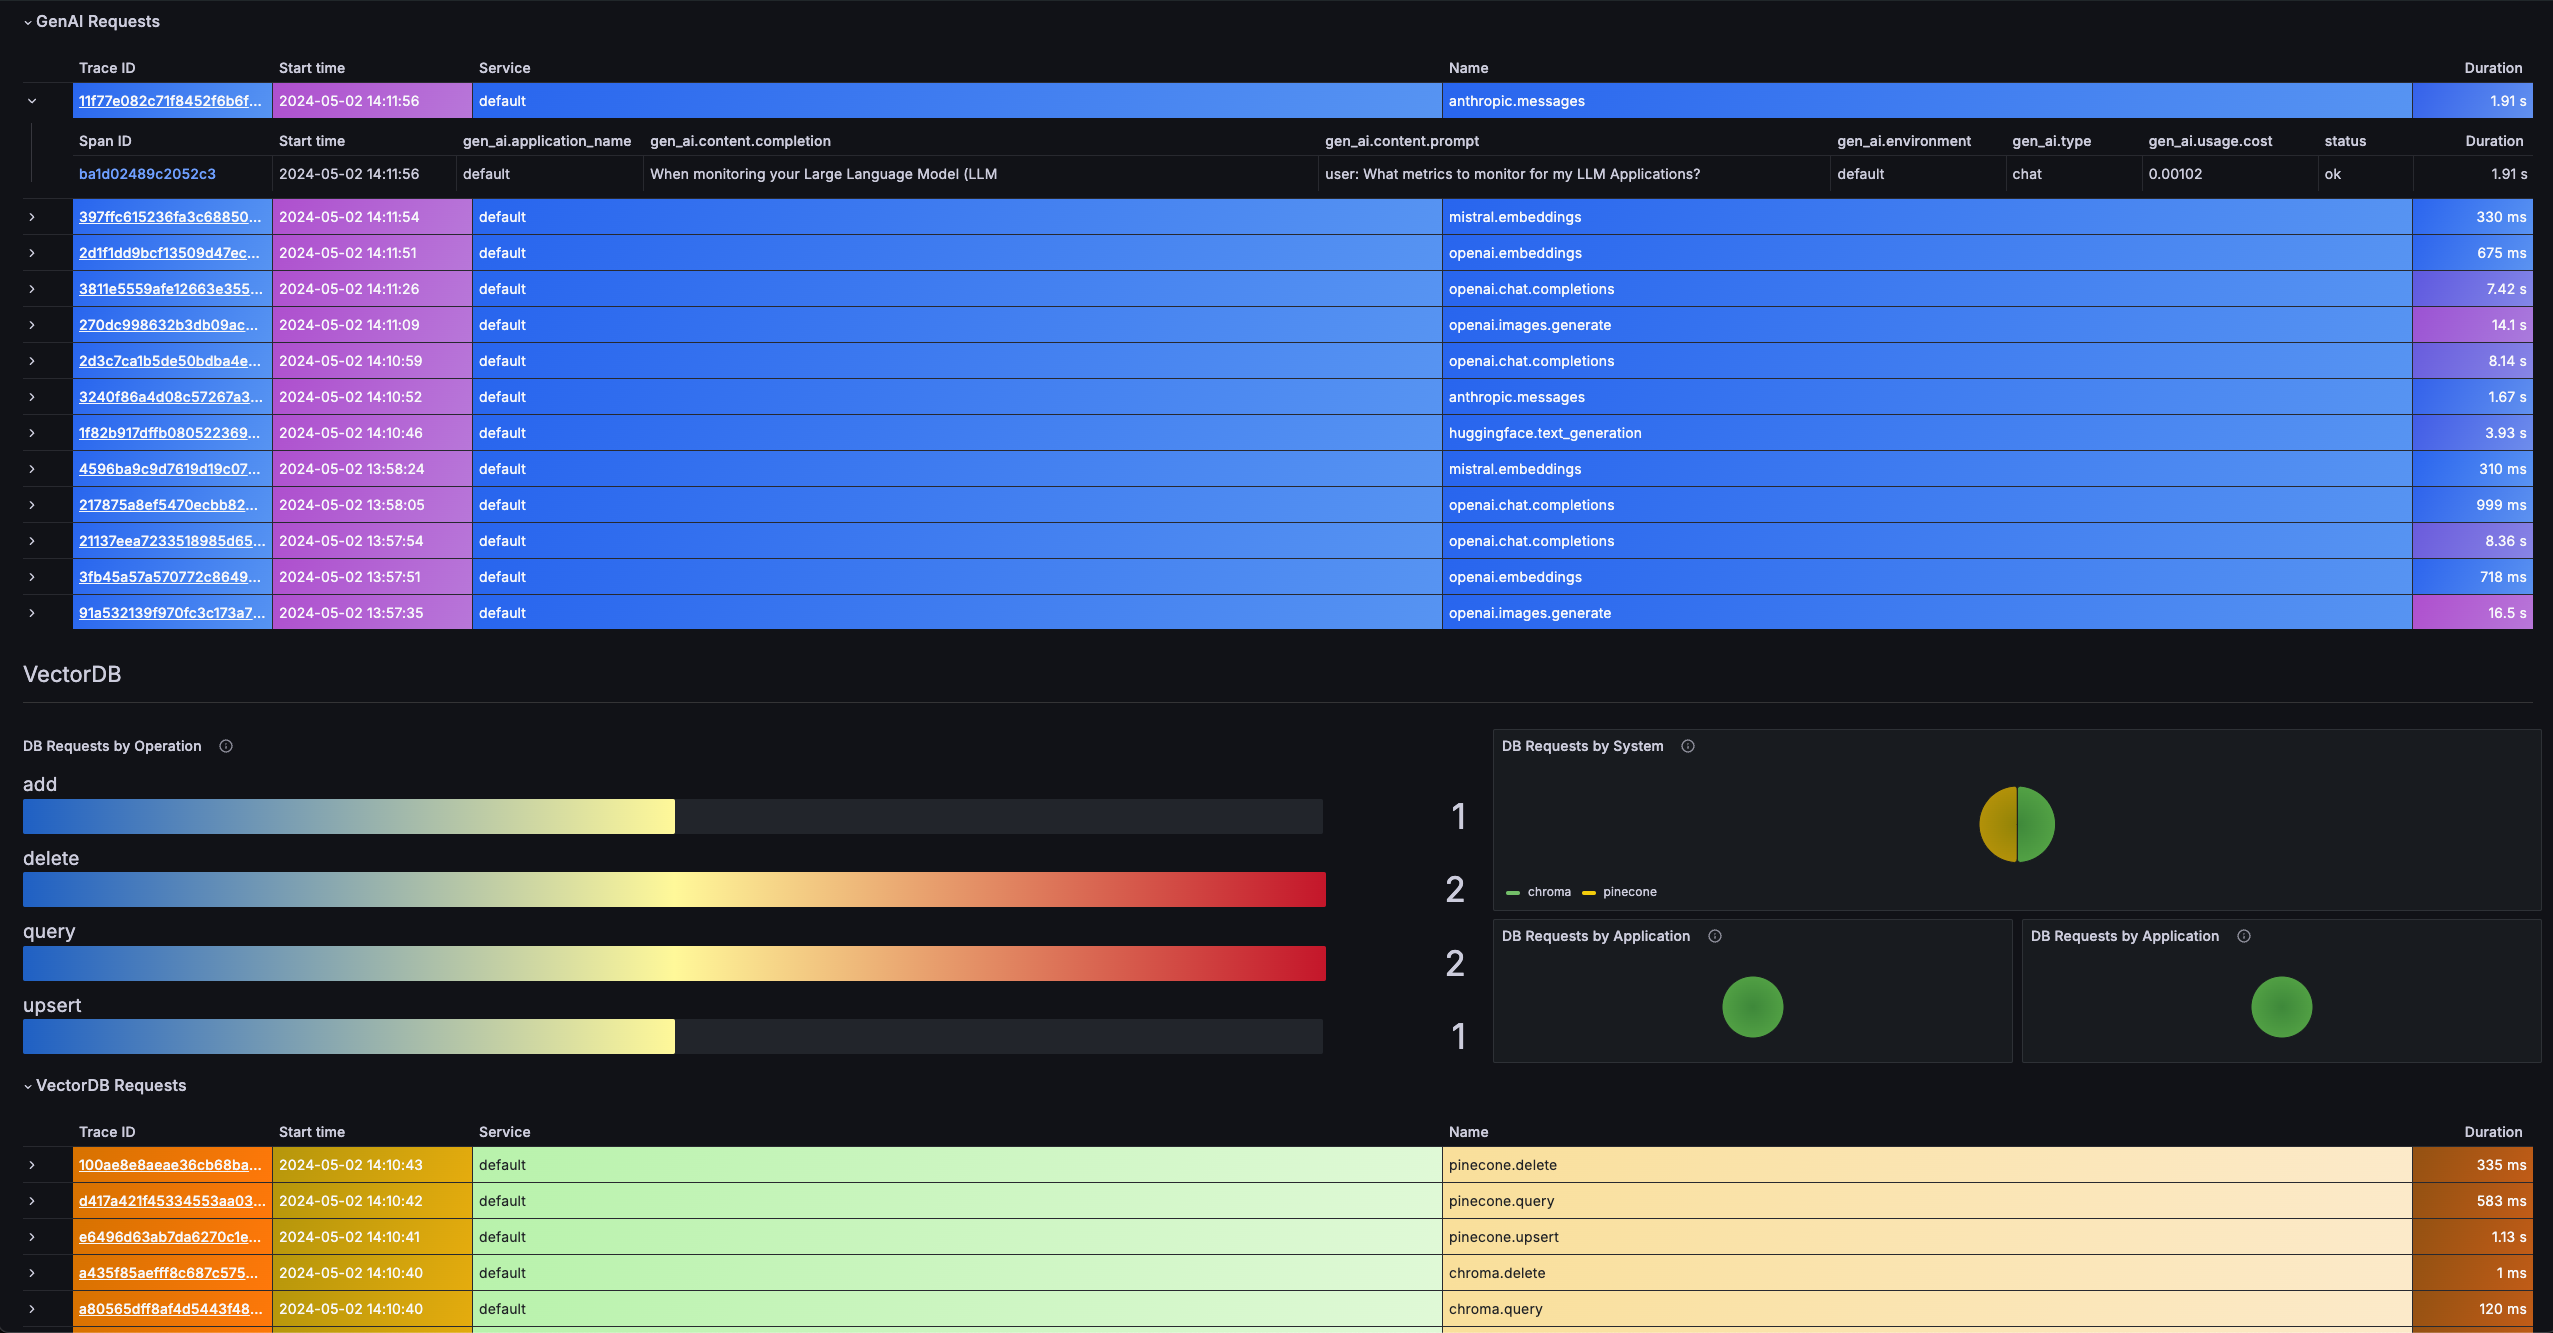
3. Import the pre-built Dashboard
- Log into your Grafana Cloud Instance.
- Click Dashboards in the primary menu.
- Click New and select Import in the drop-down menu.
- Copy the dashboard JSONs provided in the offical Grafana AI Observability repository
- Paste the dashboard JSONs one by one directly into the text area.
- Click Import.
- Save the dashboard.