To send OpenTelemetry metrics and traces generated by OpenLIT from your AI Application to Dash0, follow the below steps.

1. Dash0 Setup

Prerequisites: You’ll need a Dash0 account and authorization token. Sign up at dash0.com for a 14-days free trial, if you don’t have an account yet.

Get your Dash0 credentials

  1. Log into your Dash0 account
  2. Navigate to Organization SettingsAuth Tokens
  3. Create a new token or copy an existing one
  4. Note your Dash0 OTLP ingestion endpoint (e.g., ingress.eu-west-1.aws.dash0.com:4318 for HTTP or :4317 for gRPC)
  5. Your token will be in the format Bearer auth_xxxxx...
You can send telemetry directly to Dash0’s OTLP endpoint, or route it through an OpenTelemetry Collector for additional processing and filtering.

2. Instrument your application

For Kubernetes deployments with zero-code instrumentation:

Option 1: Direct to Dash0 Endpoint

apiVersion: openlit.io/v1alpha1
kind: AutoInstrumentation
metadata:
  name: dash0-instrumentation
  namespace: default
spec:
  selector:
    matchLabels:
      instrument: "true"
  python:
    instrumentation:
      provider: "openlit"
      version: "latest"
  otlp:
    endpoint: "https://ingress.eu-west-1.aws.dash0.com:4318"
    headers:
      Authorization: "Bearer auth_your_token_here"
    timeout: 30
  resource:
    environment: "production"
    serviceName: "my-ai-service"
Replace ingress.eu-west-1.aws.dash0.com:4318 with your Dash0 ingestion endpoint and auth_your_token_here with your actual Dash0 authorization token.

Option 2: Via OpenTelemetry Collector

For more advanced scenarios with filtering, batching, or multi-destination routing, deploy an OpenTelemetry Collector:
apiVersion: openlit.io/v1alpha1
kind: AutoInstrumentation
metadata:
  name: dash0-instrumentation
  namespace: default
spec:
  selector:
    matchLabels:
      instrument: "true"
  python:
    instrumentation:
      provider: "openlit"
      version: "latest"
  otlp:
    endpoint: "http://otel-collector.opentelemetry.svc.cluster.local:4318"
    timeout: 30
  resource:
    environment: "production"
    serviceName: "my-ai-service"
Configure your OpenTelemetry Collector to forward to Dash0:
exporters:
  otlp/dash0:
    auth:
      authenticator: bearertokenauth/dash0
    endpoint: ingress.eu-west-1.aws.dash0.com:4317

extensions:
  bearertokenauth/dash0:
    scheme: Bearer
    token: ${env:DASH0_AUTH_TOKEN}

service:
  extensions:
    - bearertokenauth/dash0
  pipelines:
    traces:
      exporters:
        - otlp/dash0
Refer to the OpenLIT Operator Documentation for more advanced configurations and use cases.

3. View your telemetry in Dash0

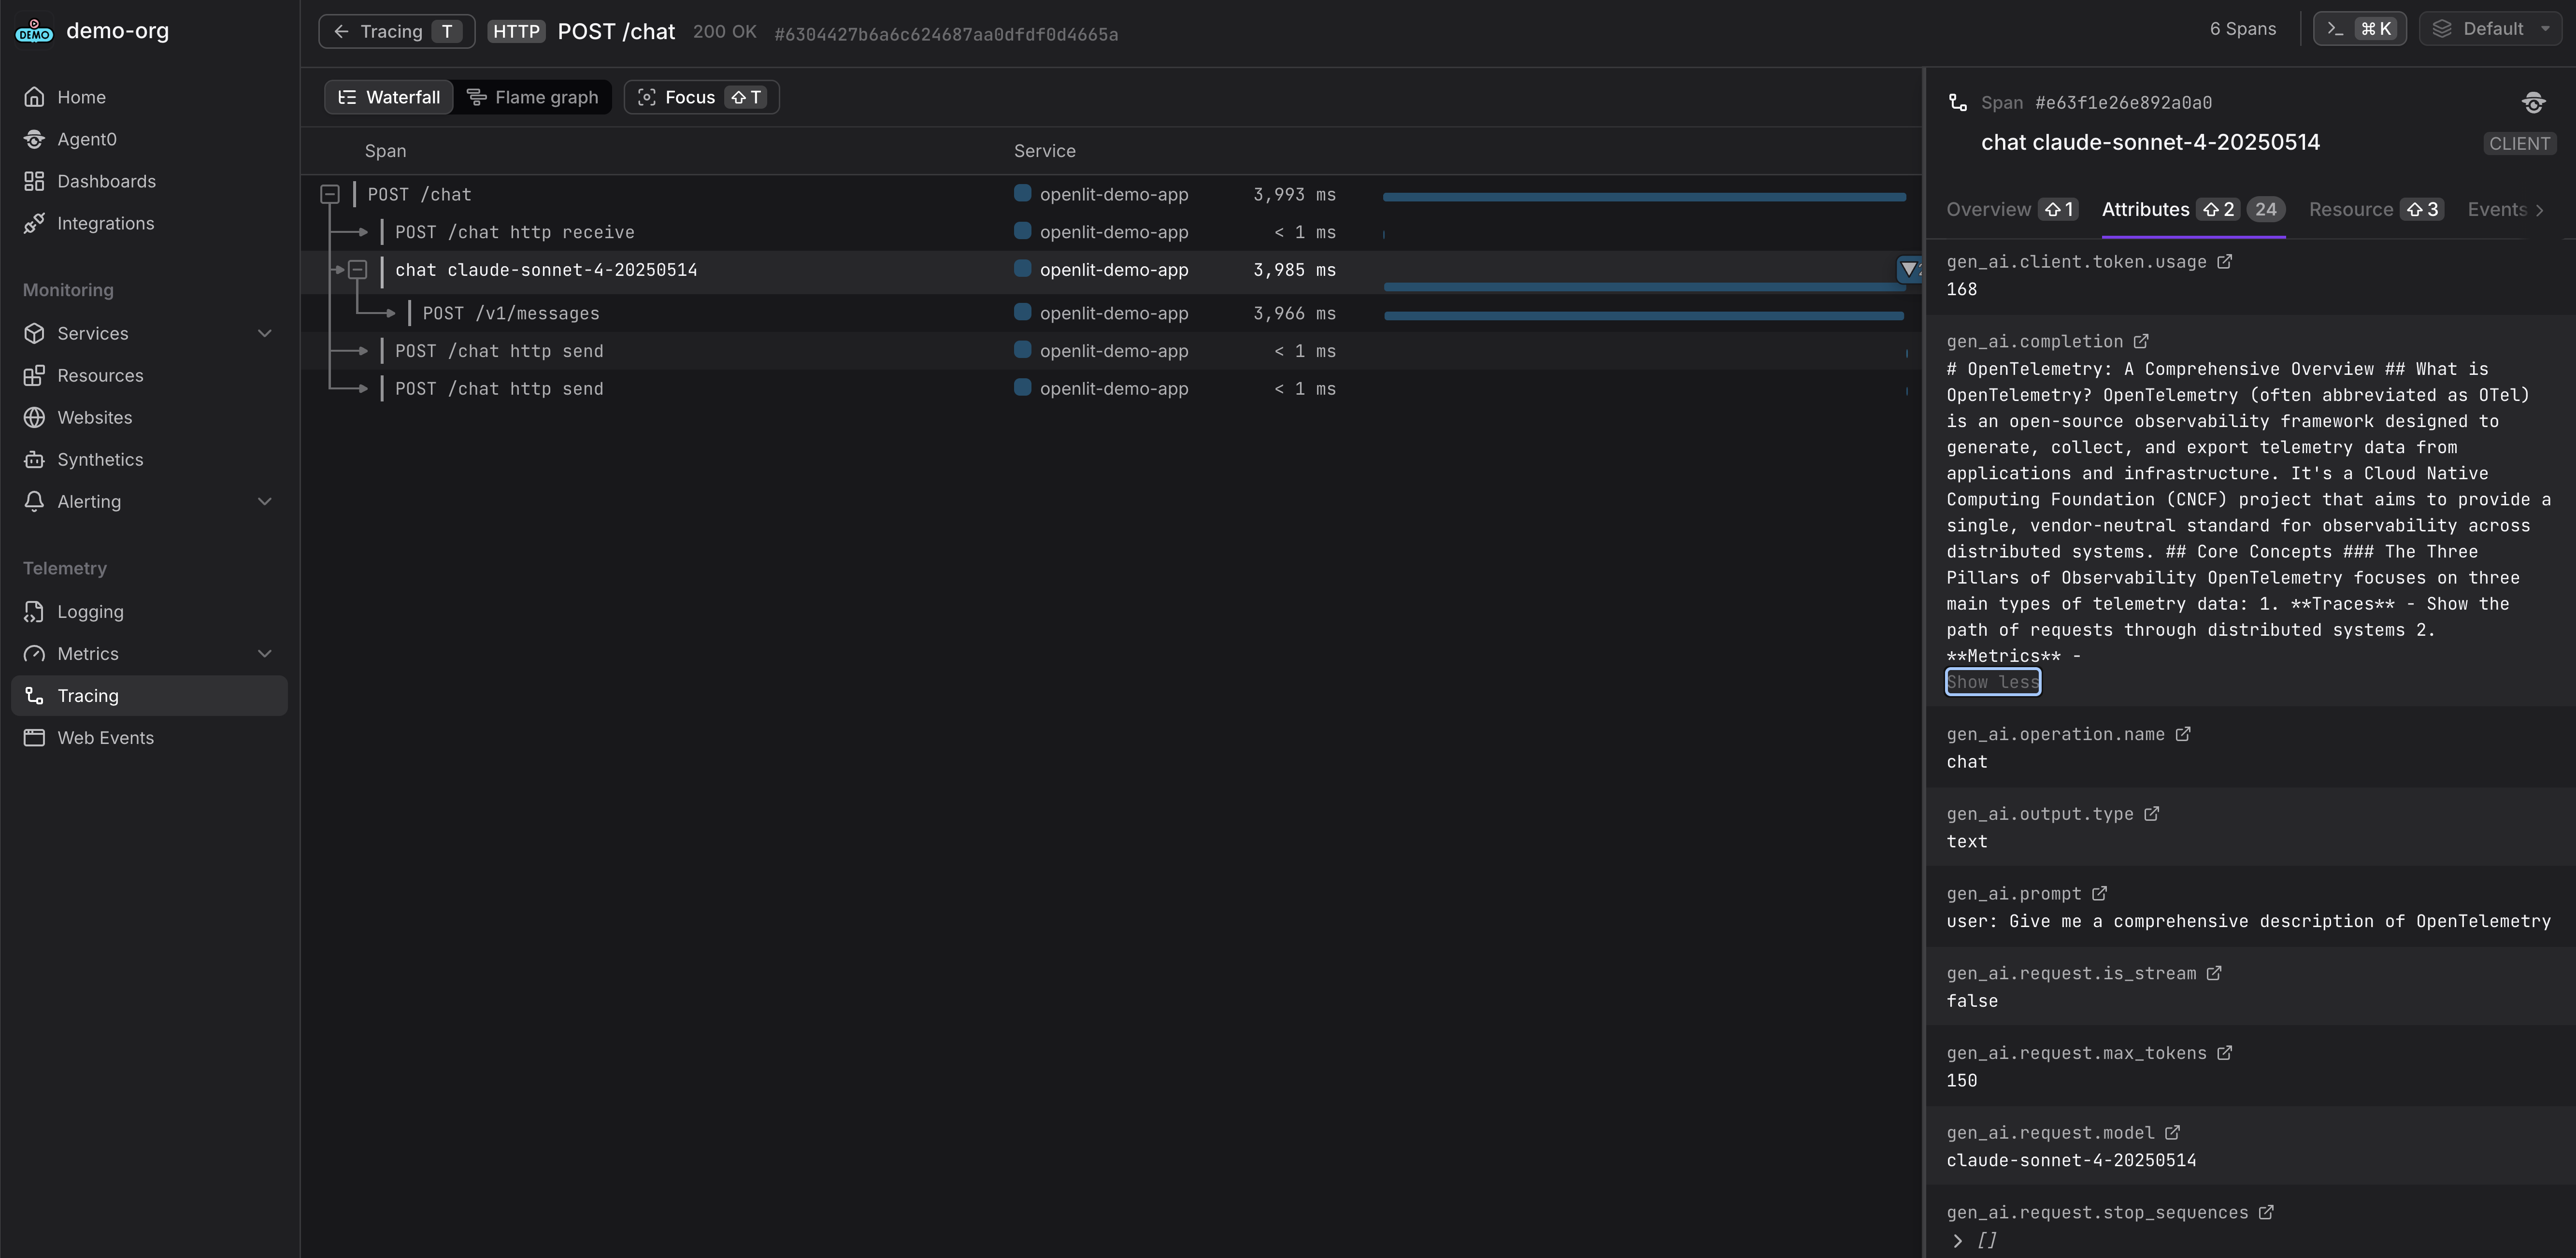
Once your AI application starts sending telemetry data, you can explore it in Dash0:
  1. Traces: Navigate to Traces to view your AI application traces with LLM calls, prompts, completions, and token usage
  2. Services: Check Services to monitor your AI service performance, error rates, and latency
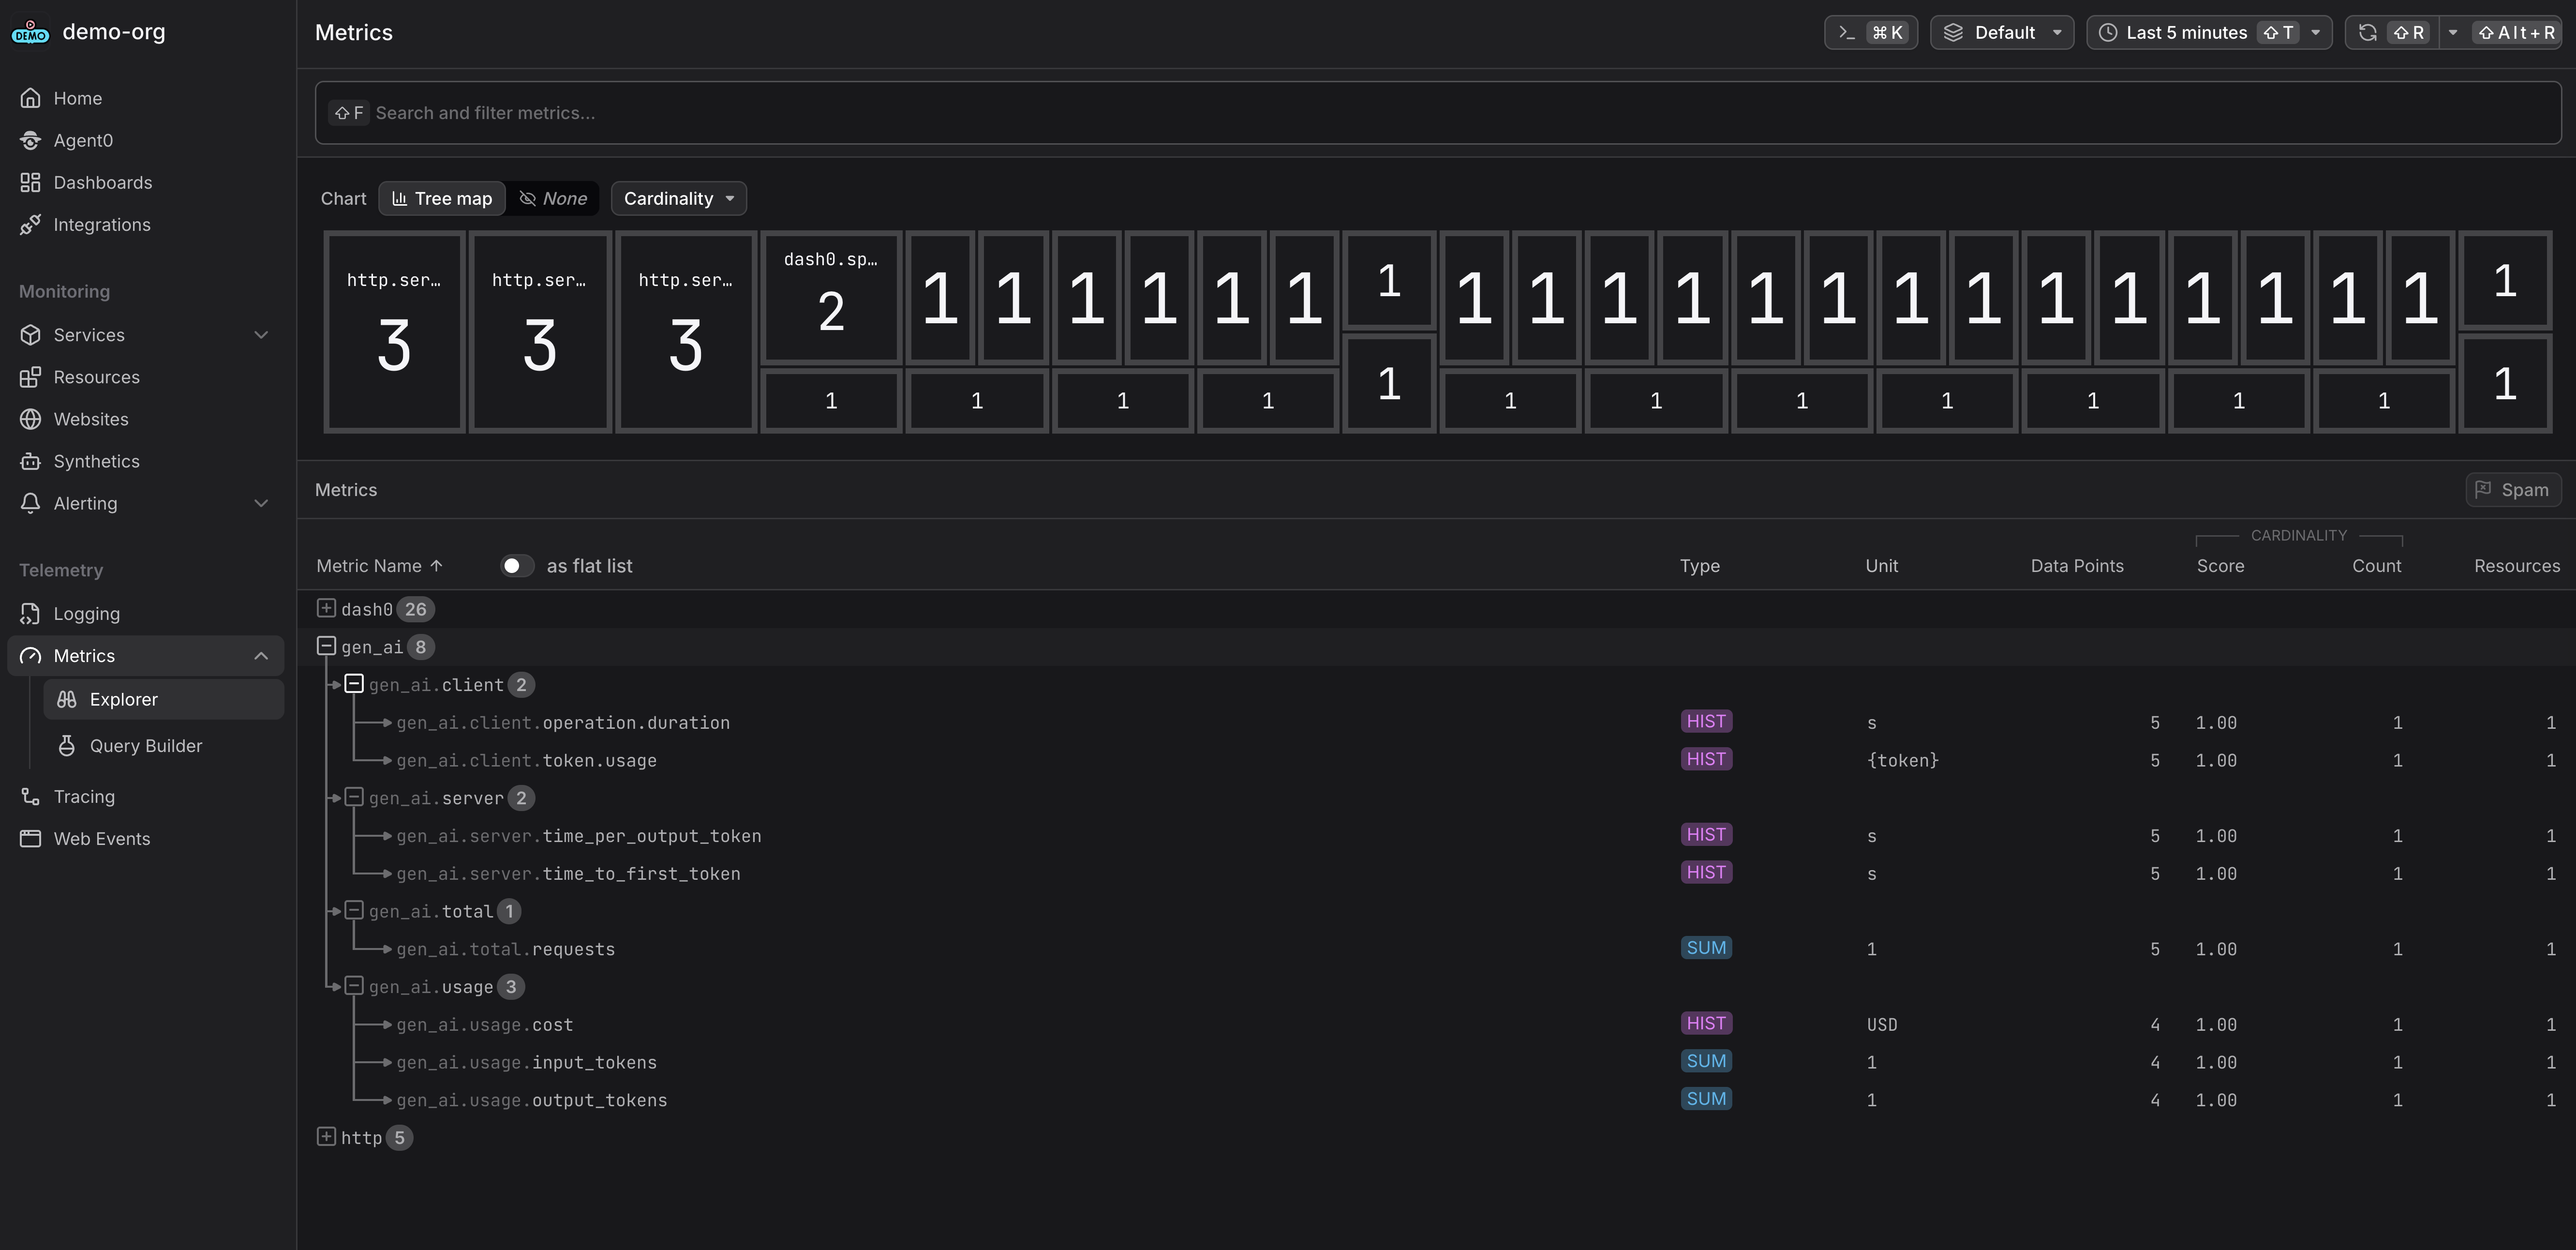
  3. Metrics: Explore metrics for token usage, costs, and AI-specific KPIs
  4. Dashboards: Create custom dashboards to track token consumption, model performance, and business metrics
  5. Query: Use PromQL-based queries to filter and analyze telemetry by model, token usage, or errors
Your OpenLIT-instrumented AI applications will appear automatically in Dash0 with comprehensive observability including LLM costs, token usage, model performance, and GPU metrics.