1. Get your Credentials
- Sign in to your OneUptime account
- Navigate to Project Settings:
- Click on More in the Navigation bar
- Click on Project Settings
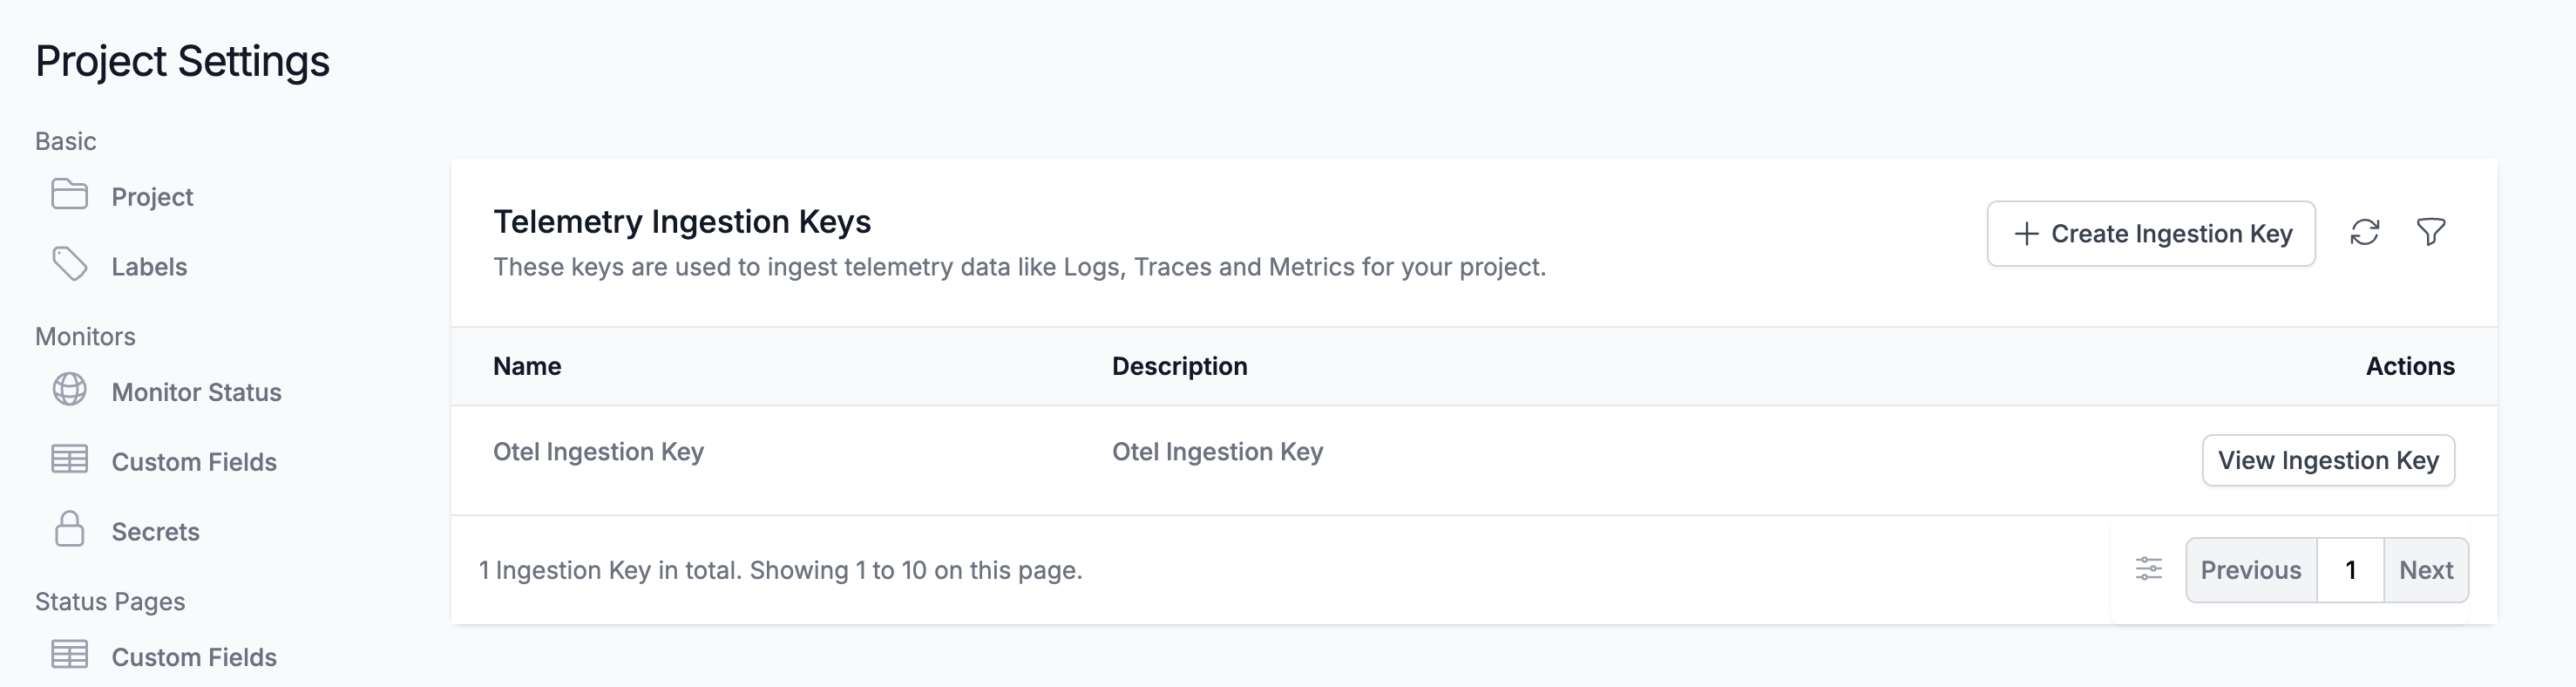
- Create Telemetry Ingestion Key:
- On the Telemetry Ingestion Key page, click on Create Ingestion Key to create a token
- On the Telemetry Ingestion Key page, click on Create Ingestion Key to create a token
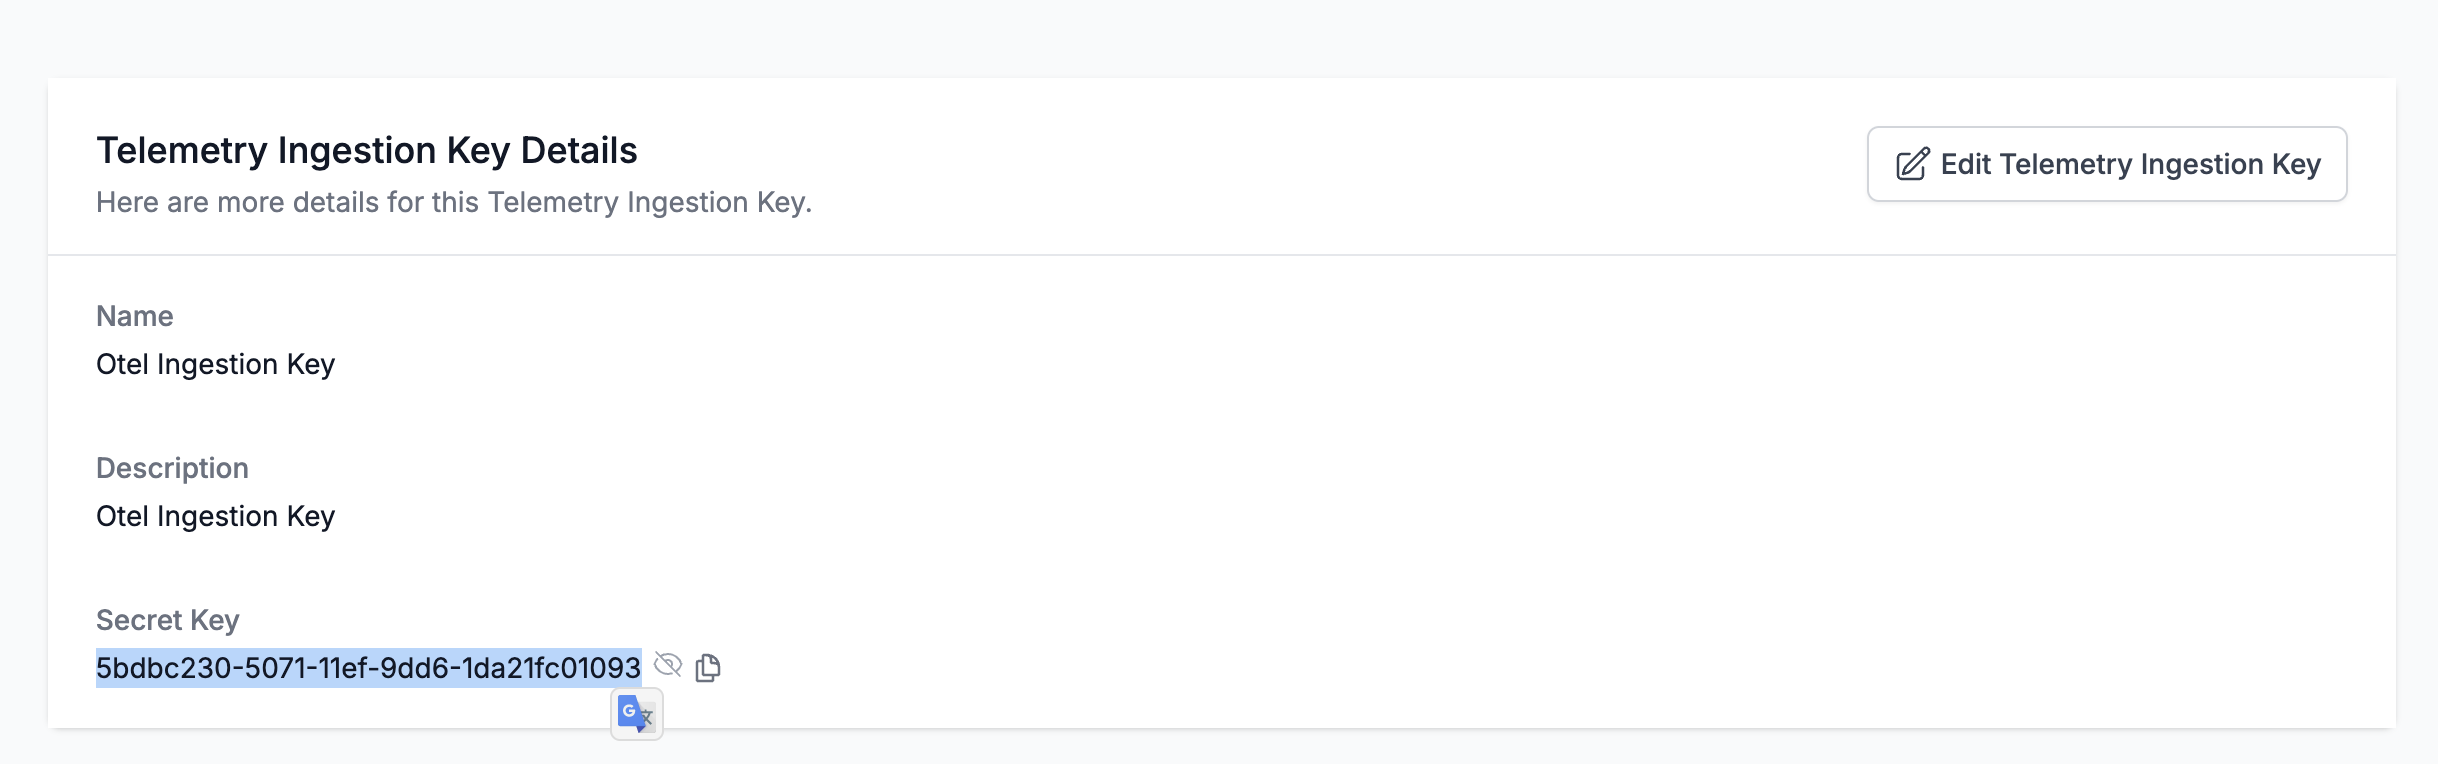
- Copy the Token:
- Once you created a token, click on View to view and copy the token
- Once you created a token, click on View to view and copy the token
2. Instrument your application
For Kubernetes deployments with zero-code instrumentation:YOUR_ONEUPTIME_SERVICE_TOKENwith the OneUptime Ingestion Key value you copied in Step 1.
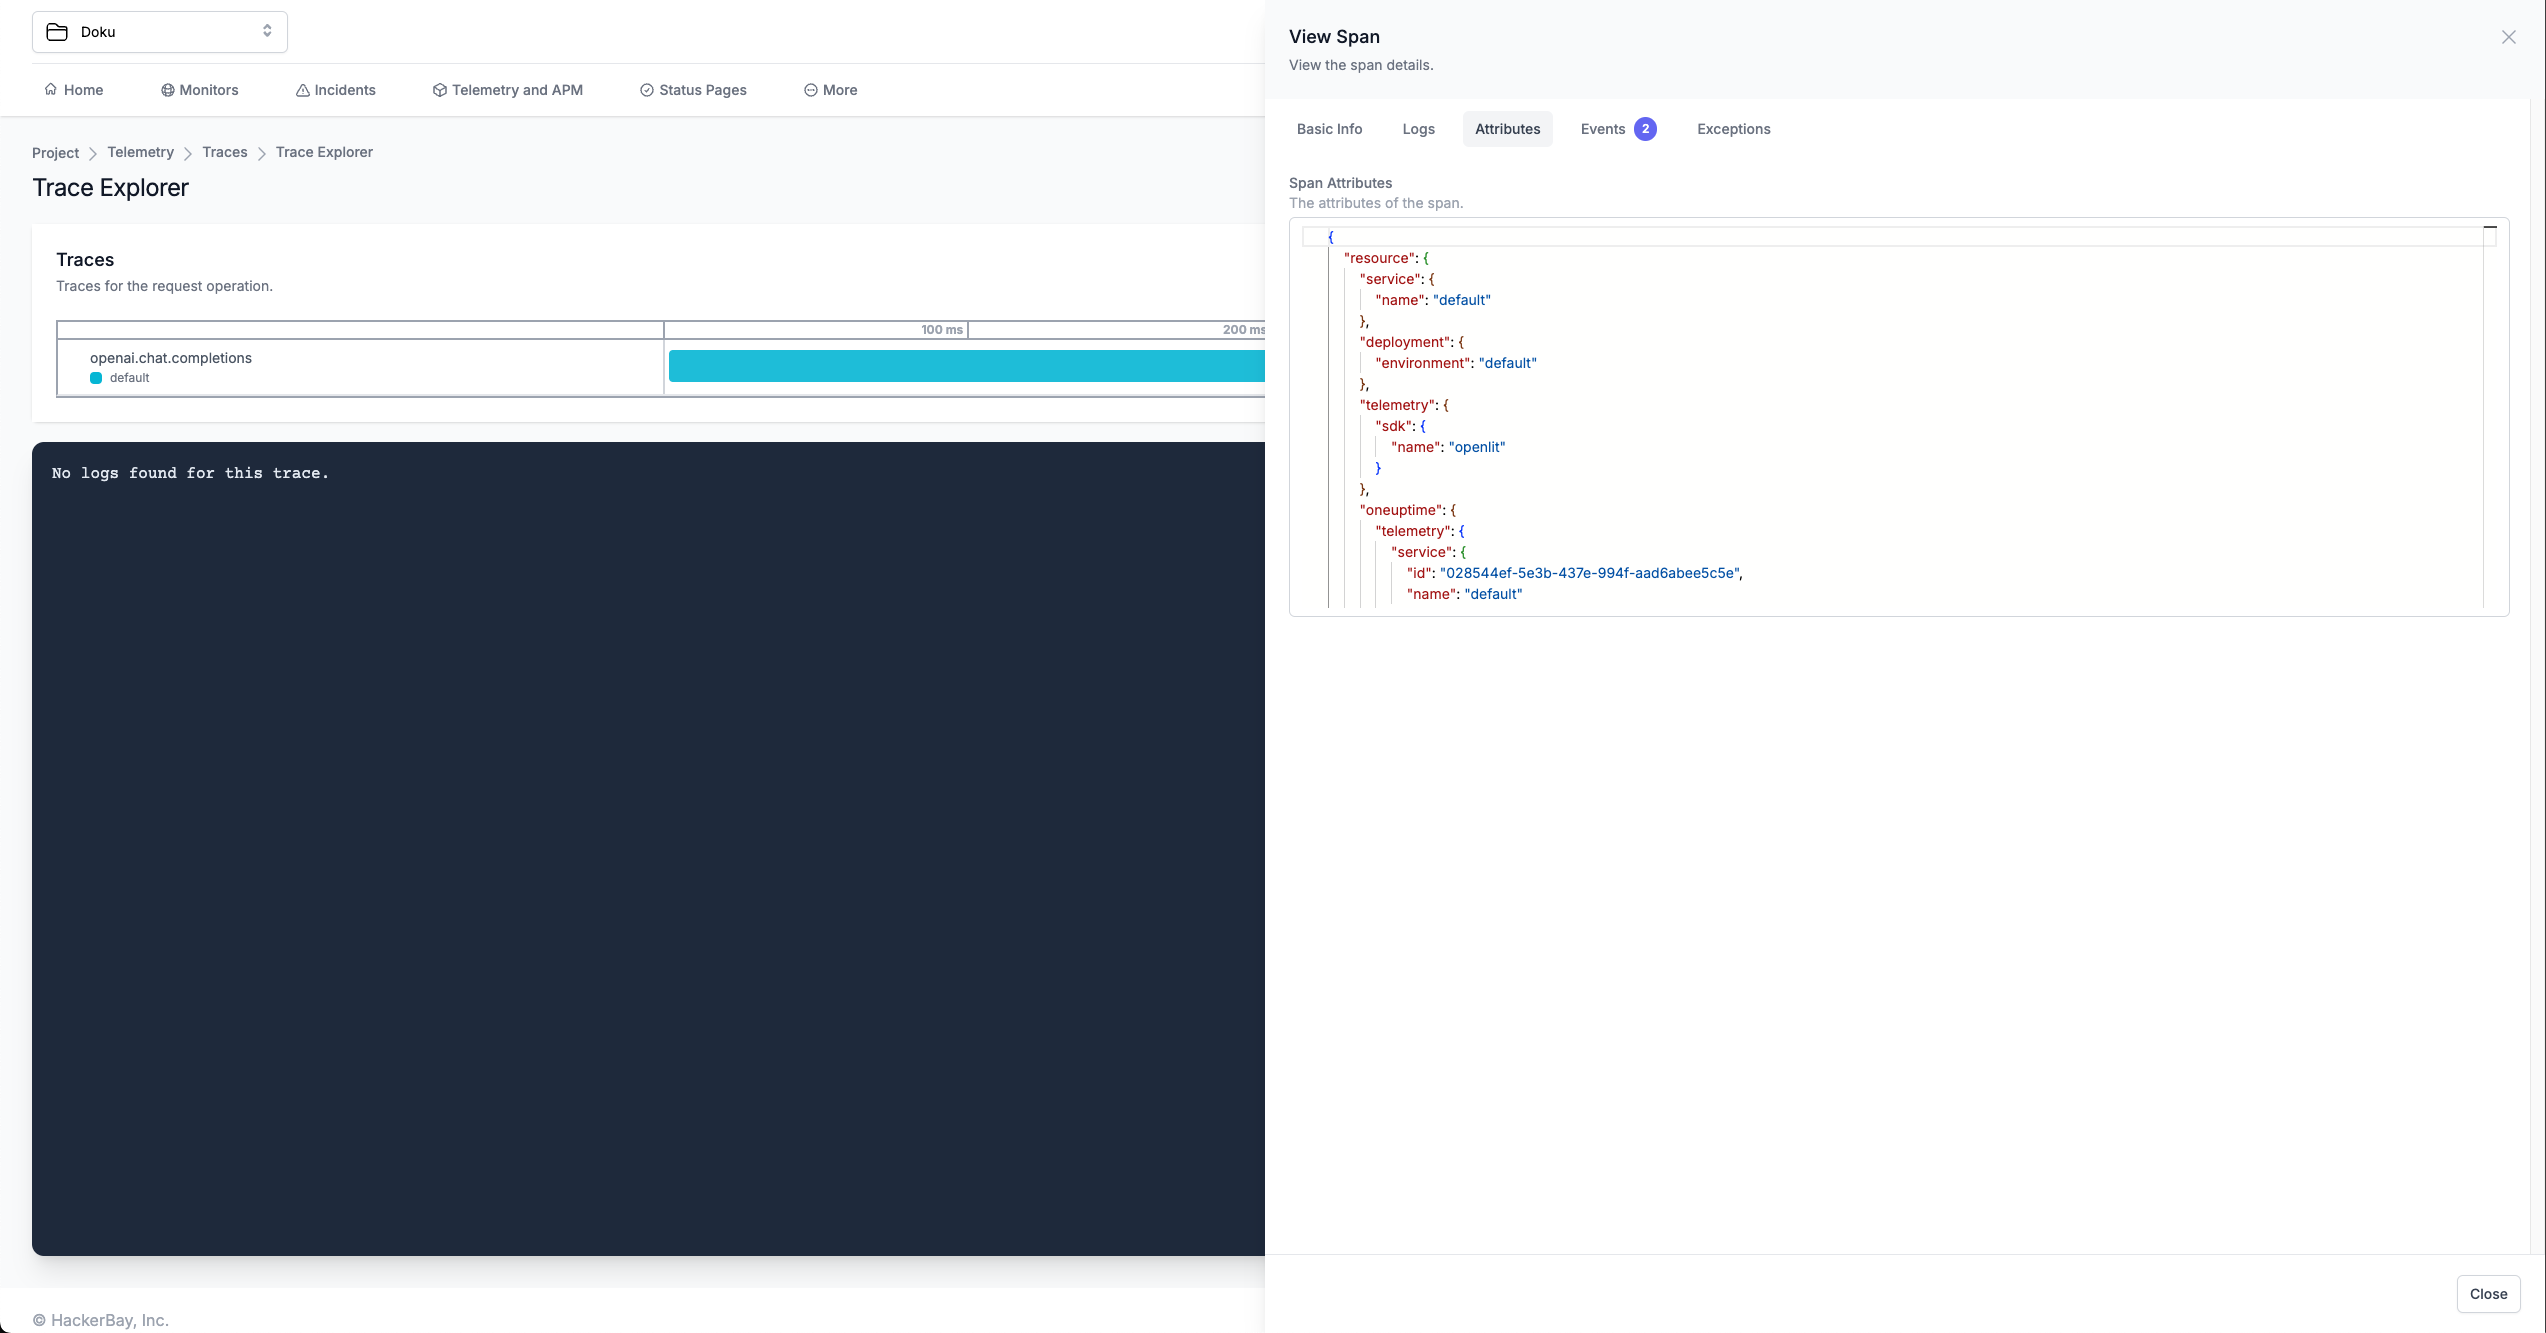
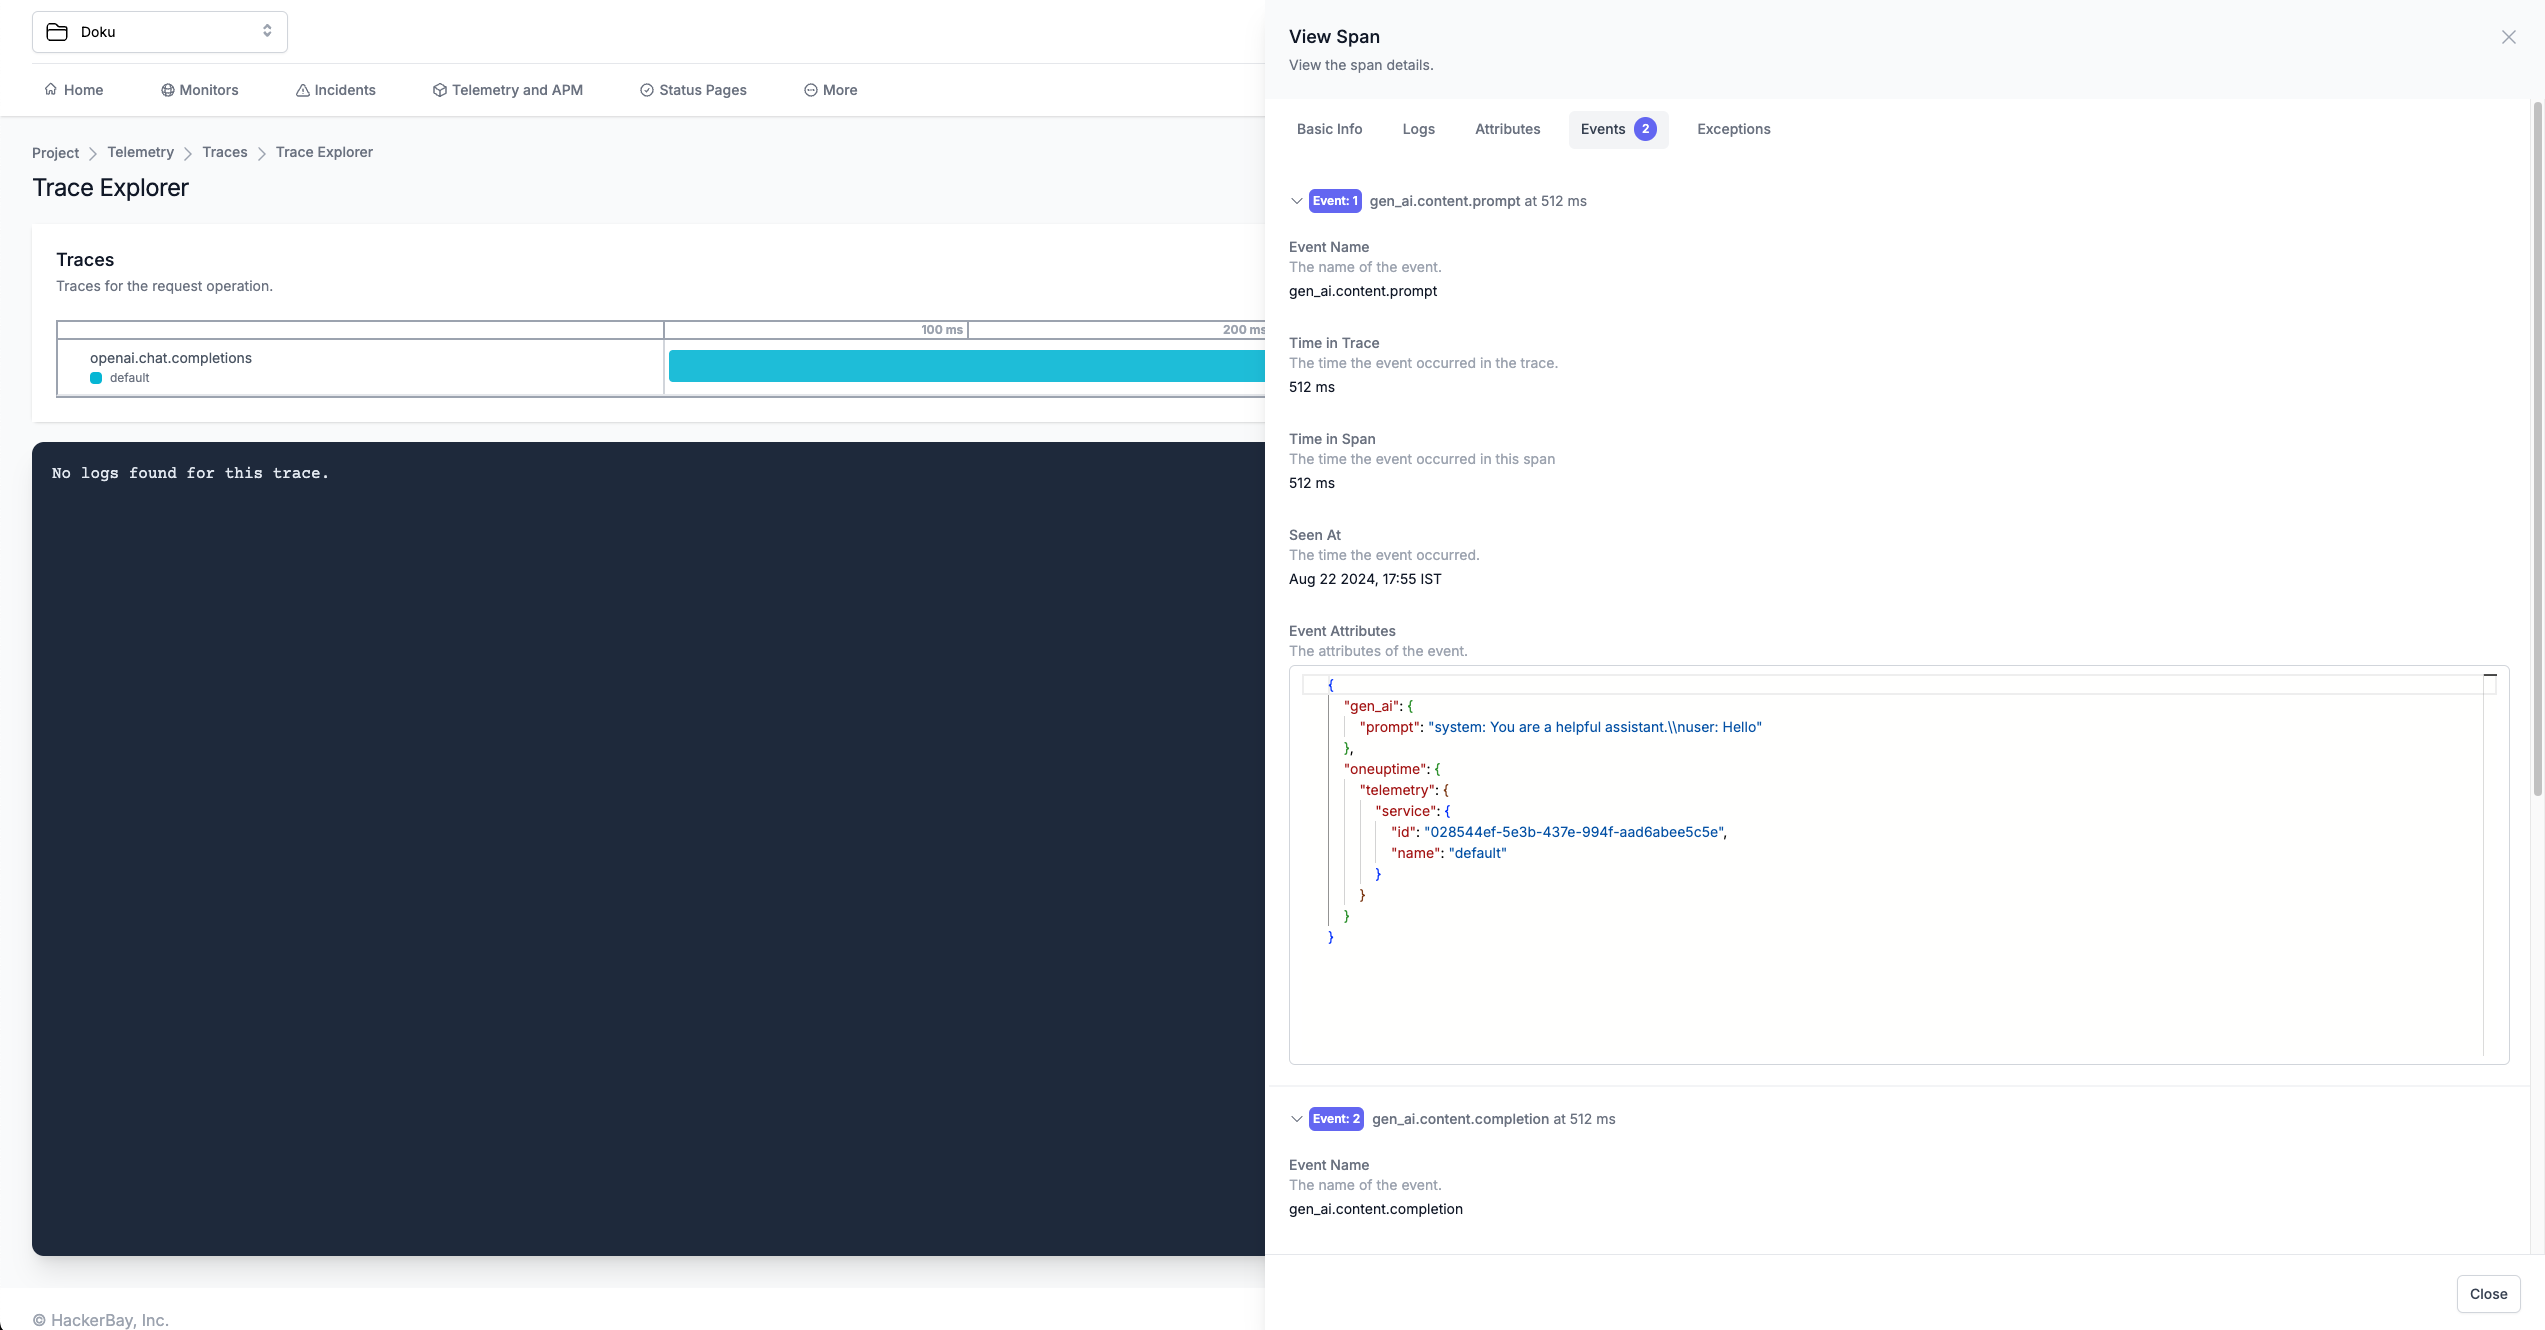
3. Visualize in OneUptime
Once your LLM application is instrumented, you can explore the telemetry data in OneUptime:- Navigate to Telemetry: Go to your OneUptime project dashboard
- View Traces: Check the Telemetry Traces page to see your AI application traces