1. Get your Credentials
- Sign up at Langfuse: Go to Langfuse Cloud or deploy Langfuse self-hosted
- Get your Project Keys:
- Public Key: Your Langfuse public key (starts with
pk-lf-) - Secret Key: Your Langfuse secret key (starts with
sk-lf-)
- Public Key: Your Langfuse public key (starts with
- Choose your data region:
- EU Region:
https://cloud.langfuse.com/api/public/otel - US Region:
https://us.cloud.langfuse.com/api/public/otel - Self-hosted:
https://your-langfuse-instance.com/api/public/otel
- EU Region:
2. Instrument your application
For Kubernetes deployments with zero-code instrumentation:<BASE64_ENCODED_AUTH>with the output from the Base64 encoding command above- Update the endpoint for your region:
- EU:
https://cloud.langfuse.com/api/public/otel - US:
https://us.cloud.langfuse.com/api/public/otel - Self-hosted:
https://your-langfuse-instance.com/api/public/otel
- EU:
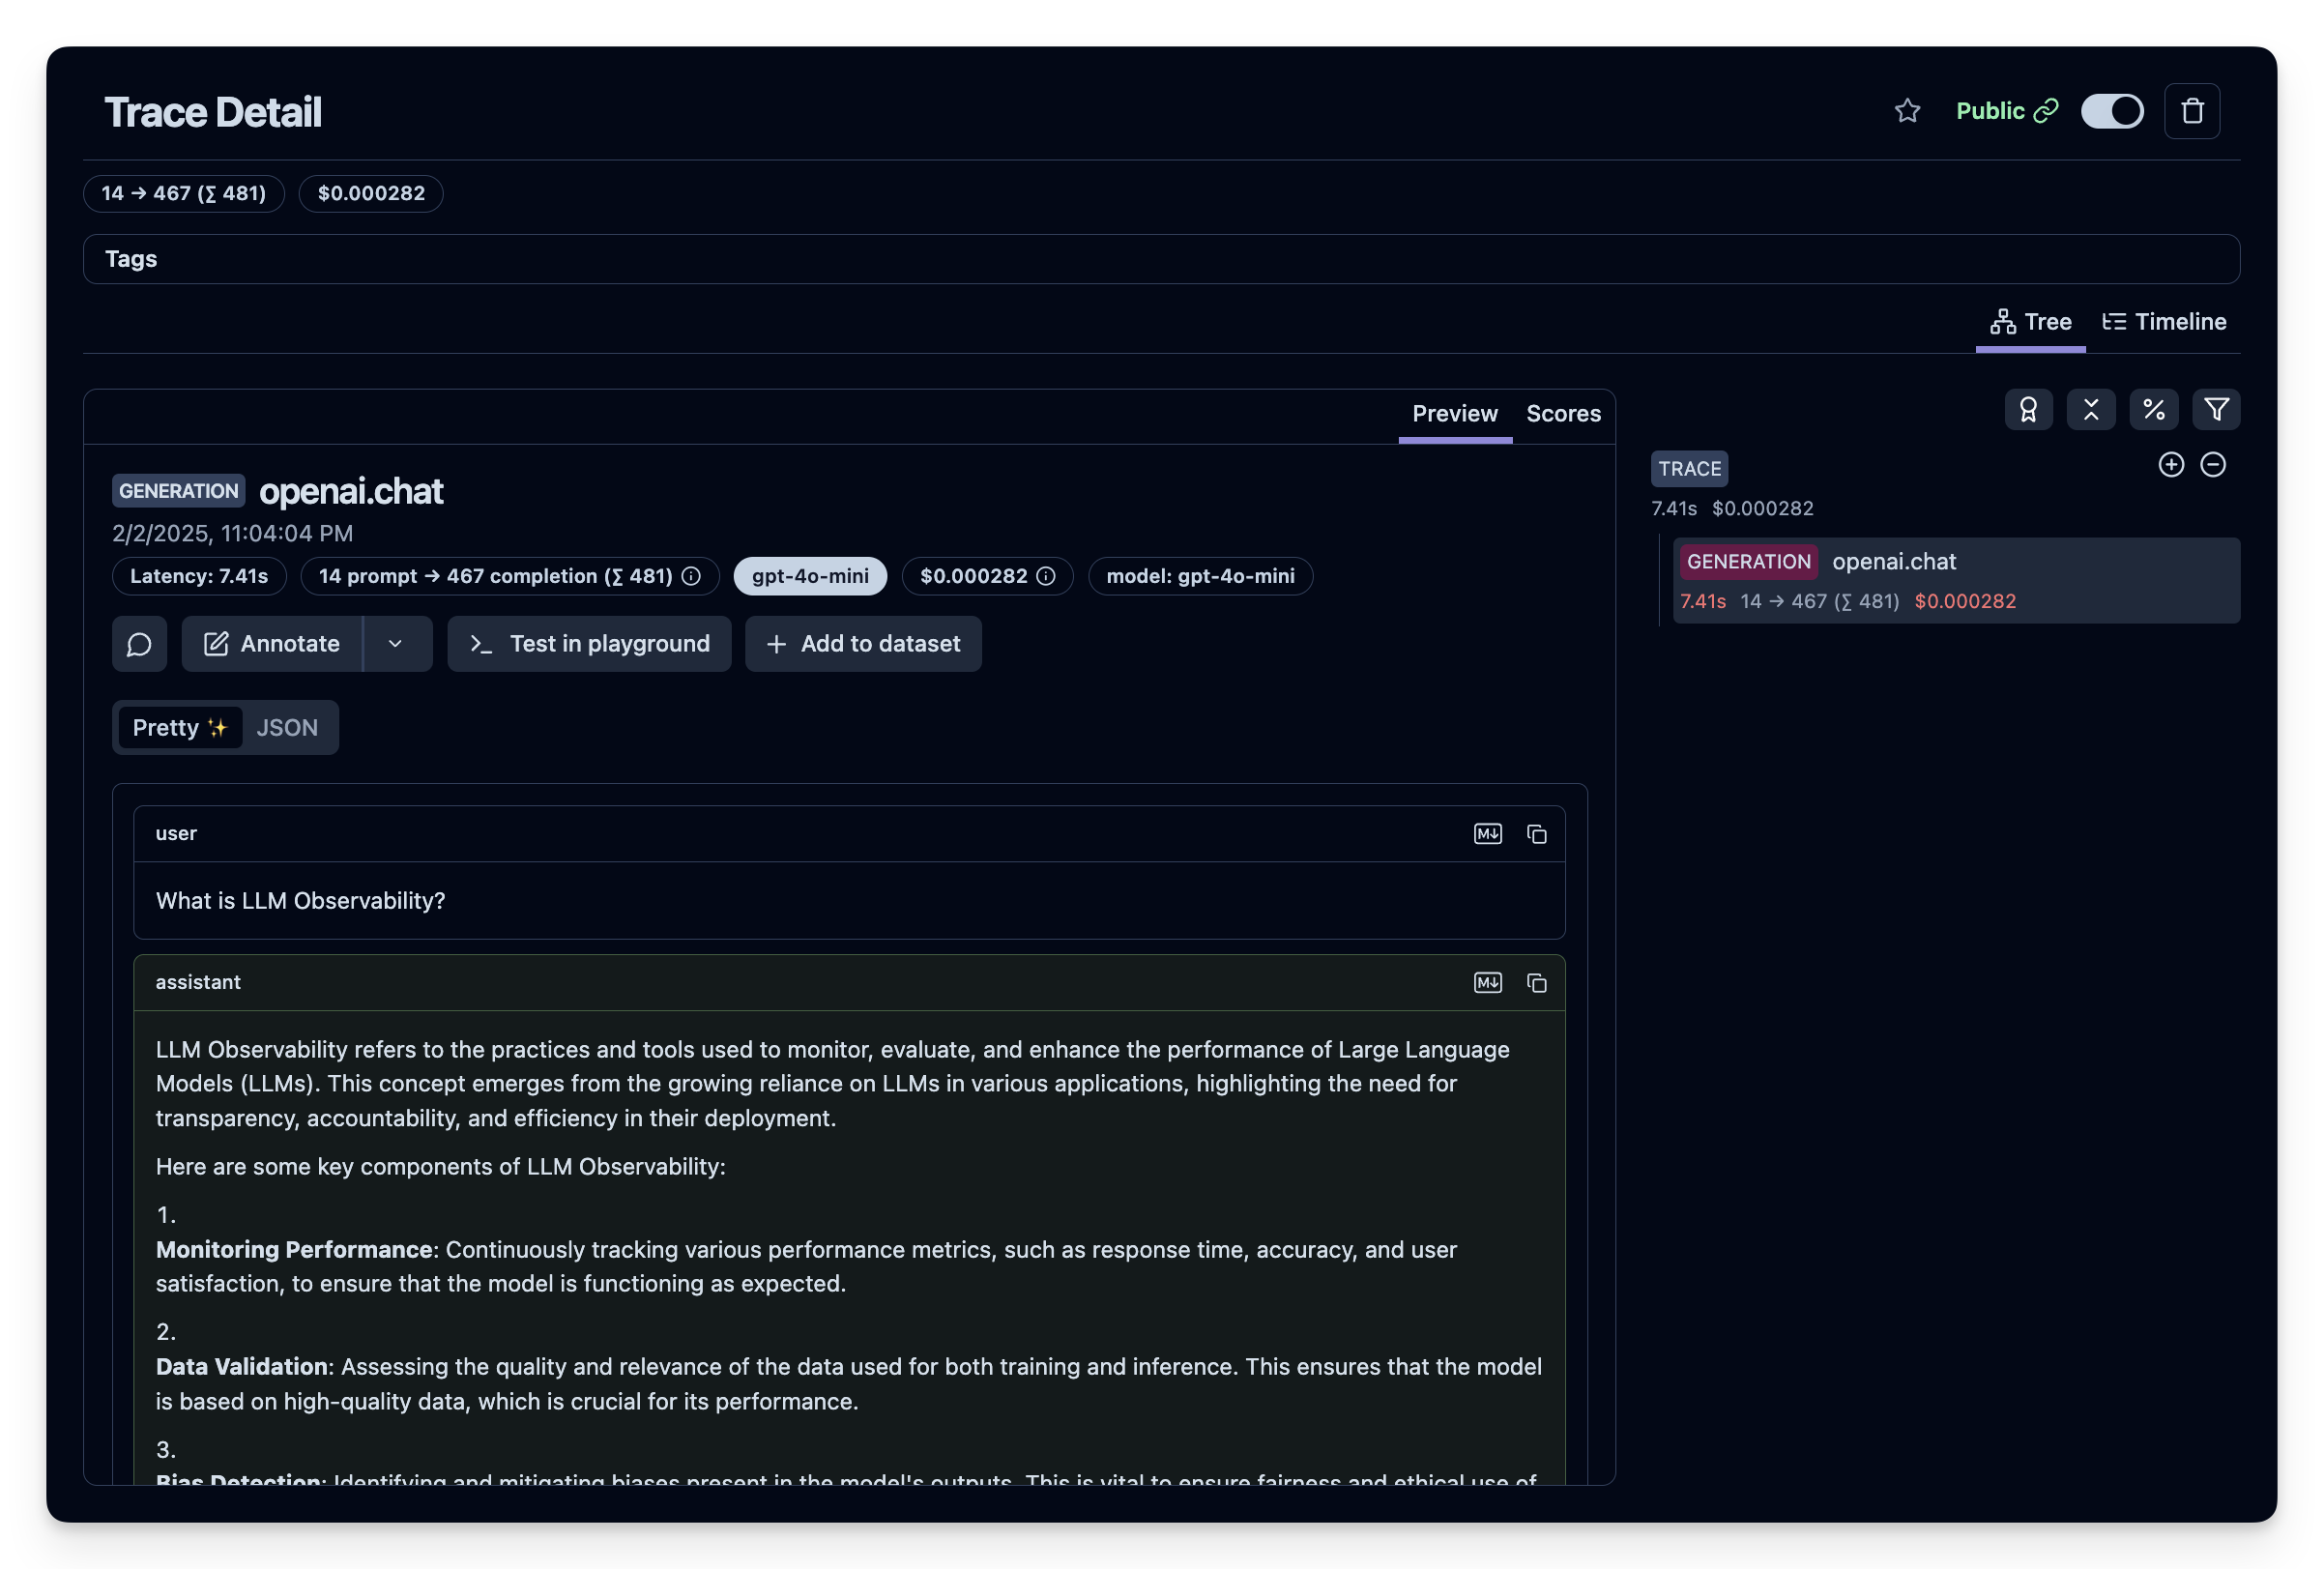
3. Visualize in Langfuse
Once your LLM application is instrumented, you can explore the telemetry data in Langfuse:- Navigate to Langfuse: Go to your Langfuse Dashboard (or your self-hosted instance)
- Explore Traces: Click on Traces in the sidebar to view your AI application traces
- View Detailed Traces: Each trace includes:
- LLM requests with detailed timing and token usage
- Model performance analytics and latency metrics
- Request/response payloads for debugging
- Cost tracking and token consumption
- Hierarchical spans showing the complete request flow
- Sessions and Users: Link traces to user sessions for comprehensive observability
- Datasets and Evaluations: Use Langfuse’s evaluation features to assess model performance
- Analytics Dashboard: Monitor trends, costs, and performance over time