1. Configure OpenTelemetry Collector
Victoria Stack requires an OpenTelemetry Collector to route metrics, logs and traces to VictoriaMetrics components. Install OpenTelemetry Collector (if not already running) For detailed installation instructions, refer to the OpenTelemetry Collector Documentation. Configure the Collector- Configure OTLP Receiver: Set up receiver on
0.0.0.0:4318for HTTP and0.0.0.0:4317for gRPC. - Define Exporters:
otlphttpfor metrics, logs and traces. - Assign to Pipelines: Route metrics, logs and traces to appropriate backends.
Complete Collector Configuration
Complete Collector Configuration
receivers:
  otlp:
    protocols:
      grpc:
        endpoint: 0.0.0.0:4317
      http:
        endpoint: 0.0.0.0:4318

exporters:
  otlphttp/victoriametrics:
    endpoint: "http://<VictoriaMetrics>/opentelemetry"
  otlphttp/victorialogs:
    endpoint: "http://<VictoriaLogs>/insert/opentelemetry"
  otlphttp/victoriatraces:
    endpoint: "http://<VictoriaTraces>/insert/opentelemetry"

service:
  pipelines:
    traces: { receivers: [ otlp ], exporters: [ otlphttp/victoriatraces ] }
    metrics: { receivers: [ otlp ], exporters: [ otlphttp/victoriametrics ] }
    logs: { receivers: [ otlp ], exporters: [ otlphttp/victorialogs ] }
2. Instrument your application
- SDK
- CLI
For direct integration into your Python applications:Replace:Set these environment variables:Replace:Refer to the OpenLIT Python SDK repository for more advanced configurations and use cases.
- Function Arguments
- Environment Variables
import openlit

openlit.init(
  otlp_endpoint="YOUR_OTELCOL_URL:4318"
)
YOUR_OTELCOL_URL:4318with the HTTP endpoint of your OpenTelemetry Collector.- Example:
http://127.0.0.1:4318(for local collector) - Example:
http://otel-collector.monitoring.svc.cluster.local:4318(for Kubernetes)
- Example:
import openlit

openlit.init()
export OTEL_EXPORTER_OTLP_ENDPOINT="YOUR_OTELCOL_URL:4318"
YOUR_OTELCOL_URL:4318with the HTTP endpoint of your OpenTelemetry Collector.- Example:
http://127.0.0.1:4318(for local collector) - Example:
http://otel-collector.monitoring.svc.cluster.local:4318(for Kubernetes)
- Example:
For zero-code auto-instrumentation via command line:Replace:Replace:Refer to the OpenLIT Python SDK repository for more advanced configurations and use cases.
- CLI Arguments
- Environment Variables
# Using CLI arguments
openlit-instrument \
  --otlp-endpoint "YOUR_OTELCOL_URL:4318" \
  --service-name "my-ai-service" \
  --deployment-environment "production" \
  python app.py
YOUR_OTELCOL_URL:4318with the HTTP endpoint of your OpenTelemetry Collector.- Example:
http://127.0.0.1:4318(for local collector) - Example:
http://otel-collector.monitoring.svc.cluster.local:4318(for Kubernetes)
- Example:
# Set environment variables (takes precedence over CLI args)
export OTEL_EXPORTER_OTLP_ENDPOINT="YOUR_OTELCOL_URL:4318"
export OTEL_SERVICE_NAME="my-ai-service"
export OTEL_DEPLOYMENT_ENVIRONMENT="production"

# Run your application
openlit-instrument python app.py
YOUR_OTELCOL_URL:4318with the HTTP endpoint of your OpenTelemetry Collector.- Example:
http://127.0.0.1:4318(for local collector) - Example:
http://otel-collector.monitoring.svc.cluster.local:4318(for Kubernetes)
- Example:
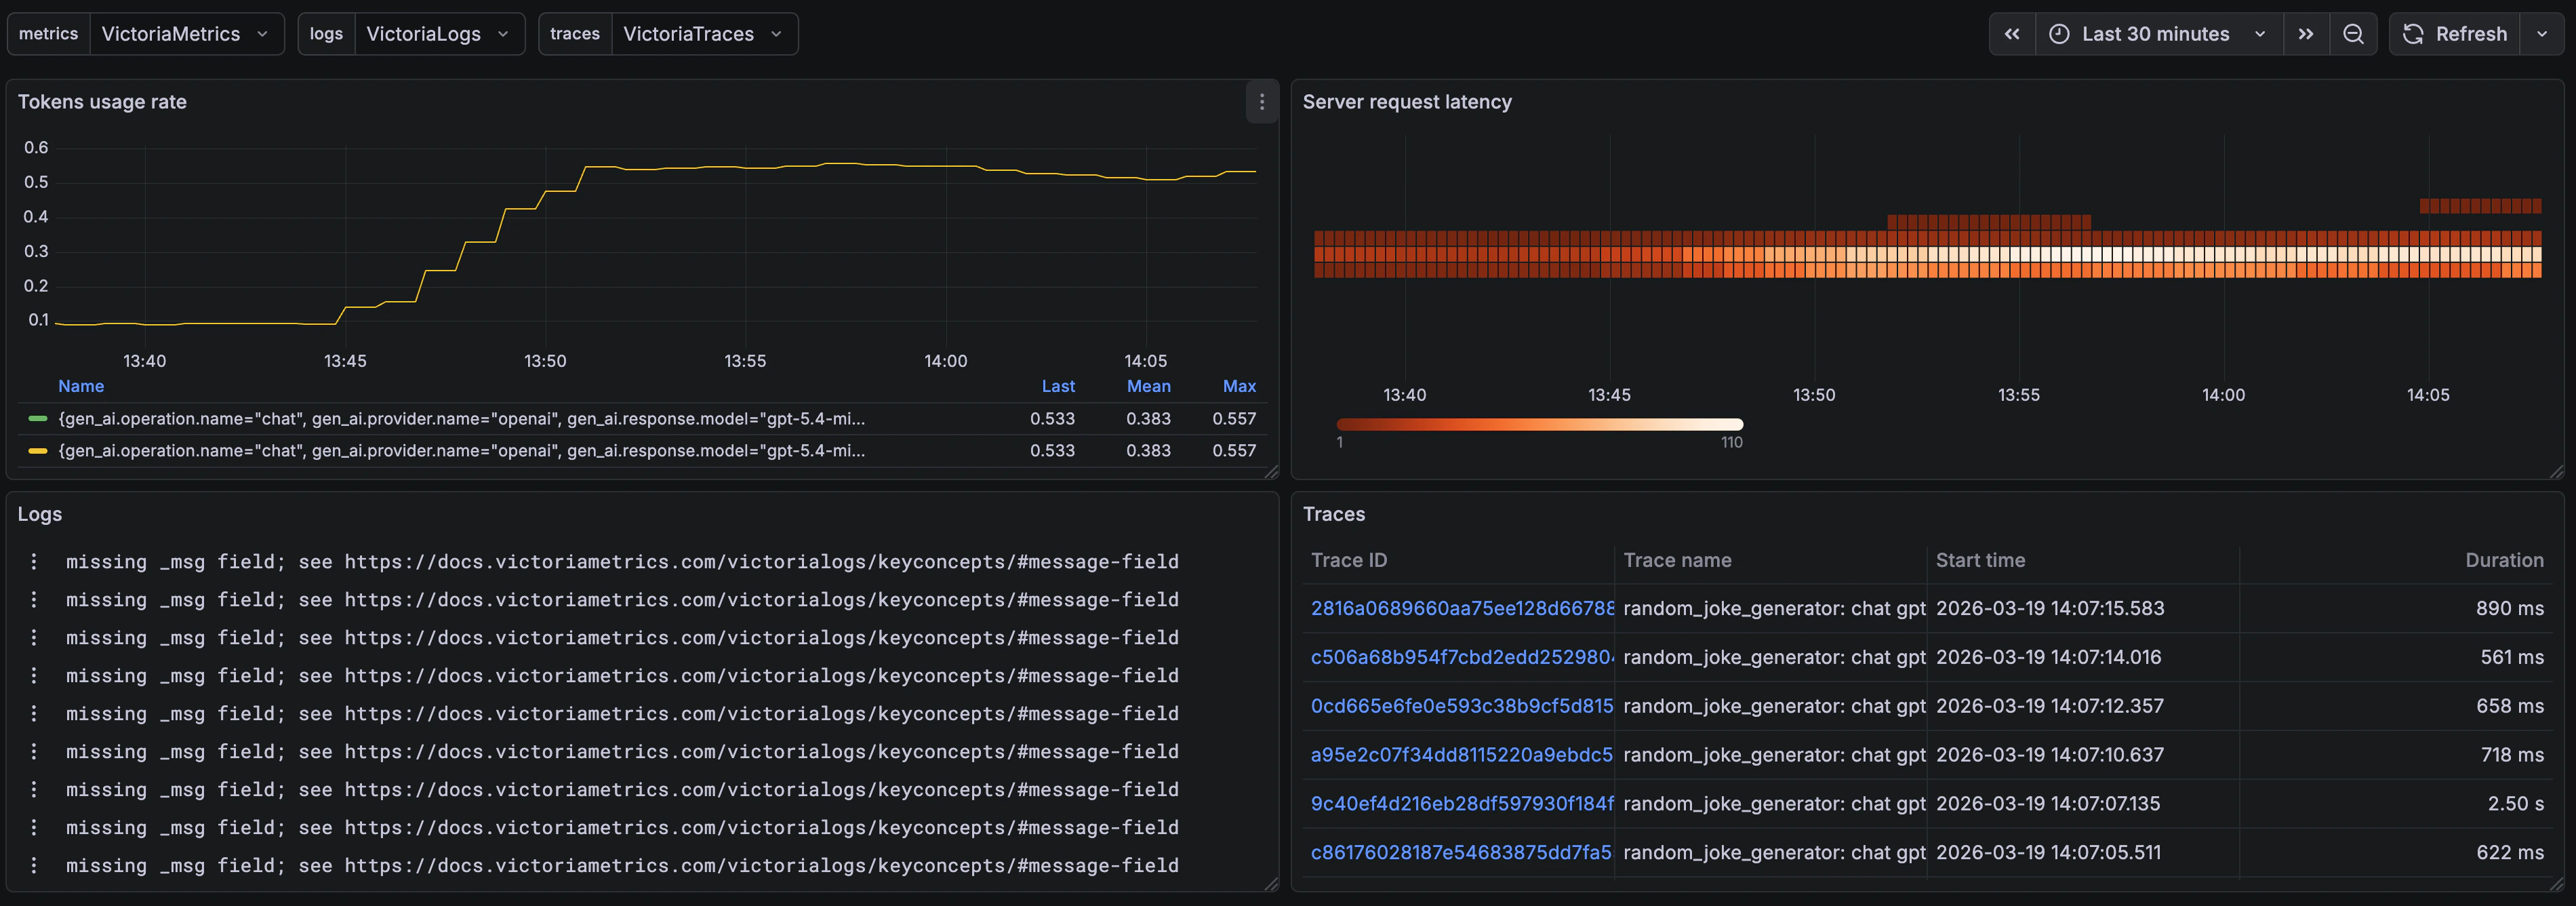
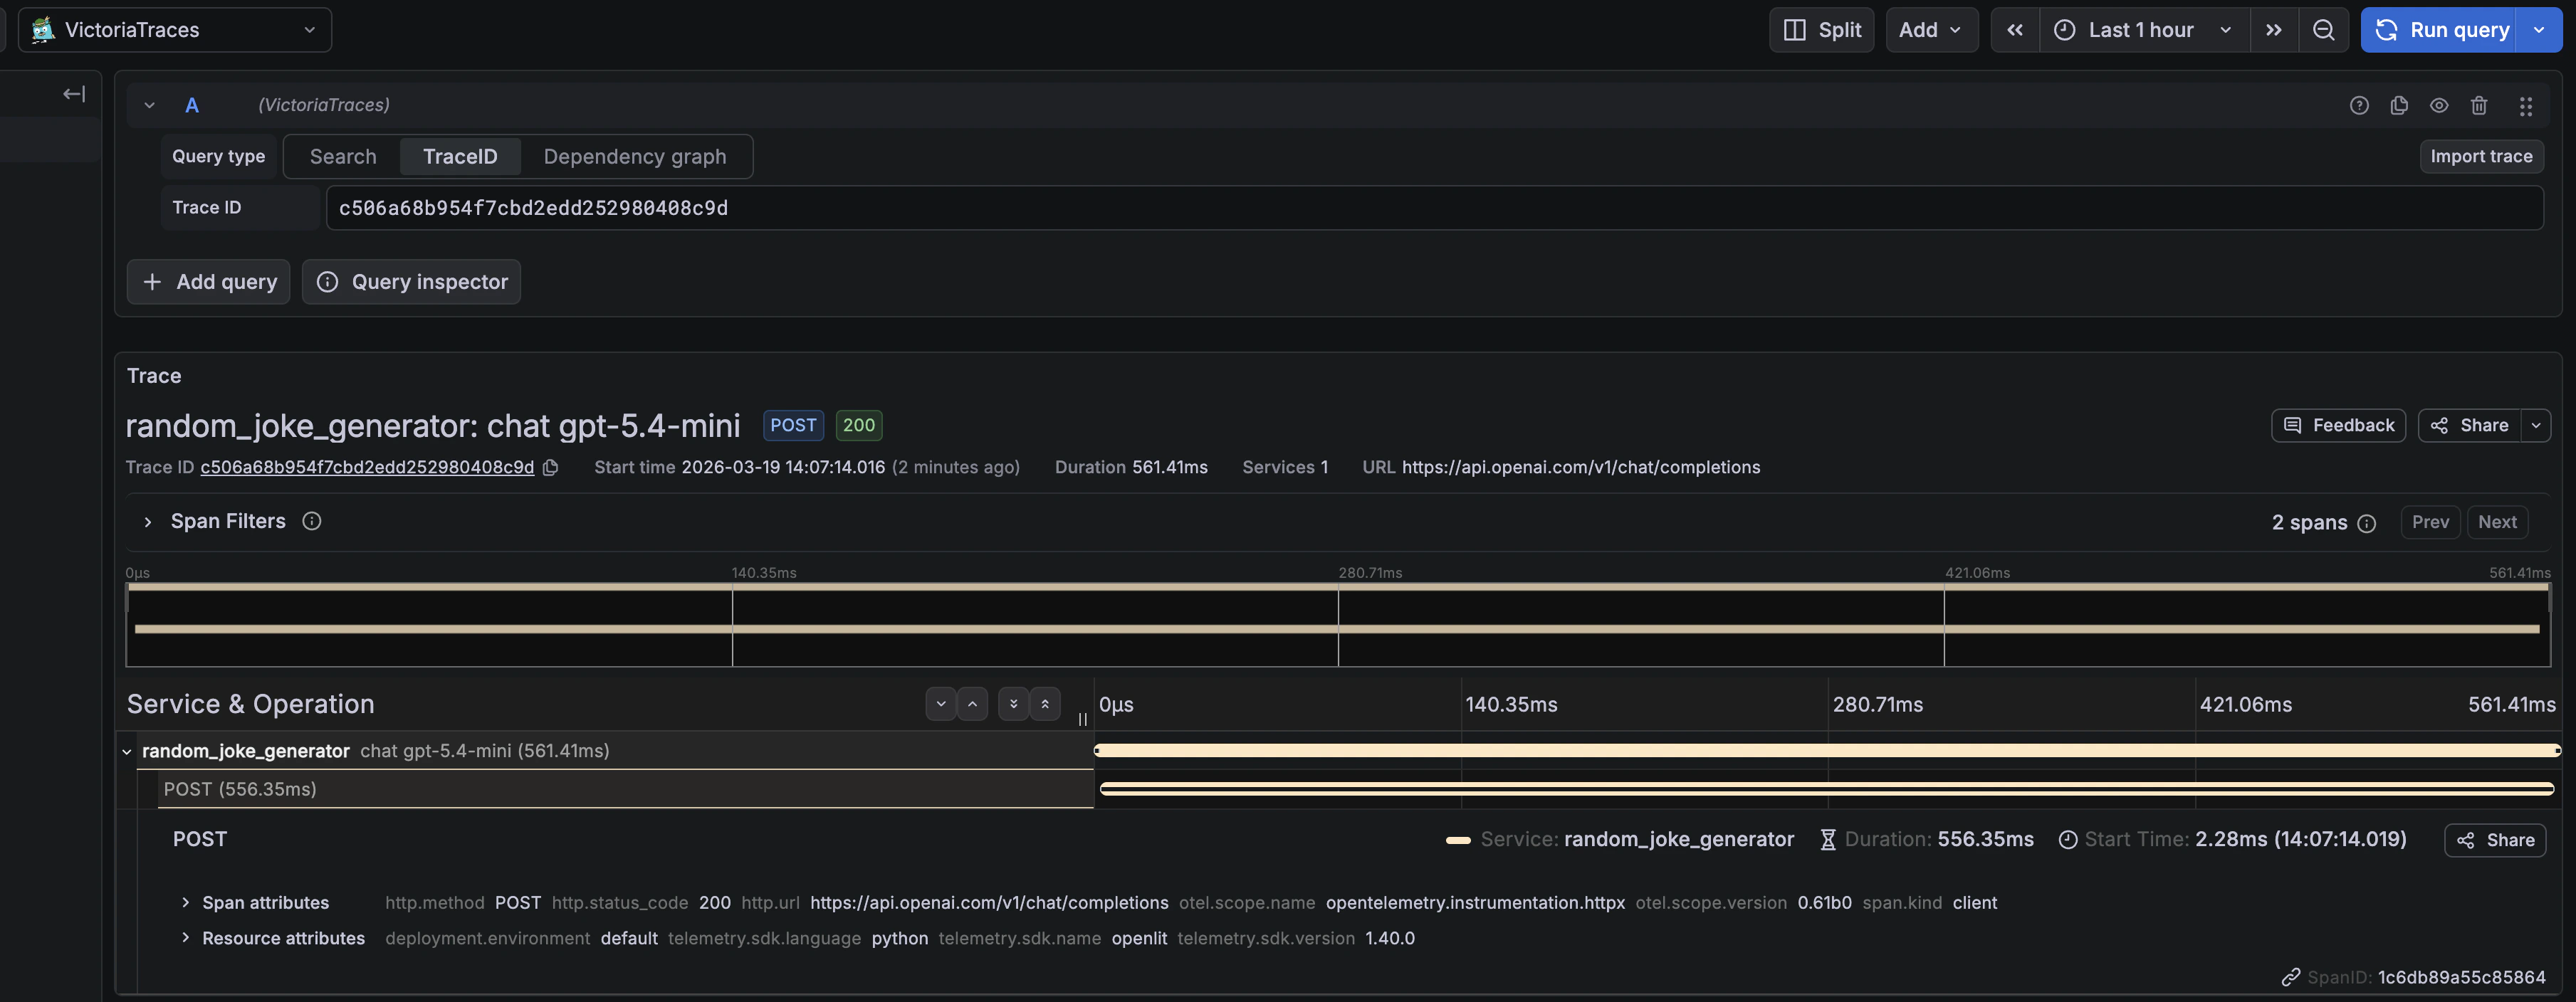
3. Import the pre-built Dashboard
- Log into your Grafana Instance. To install Grafana, refer to the Official documentation.
- Add Data Sources: Make sure Prometheus (VictoriaMetrics), Jaeger (VictoriaTraces) and VictoriaLogs are added as data sources in Grafana. To add a new data source, follow the steps in the Official documentation.
- Import Dashboard: Once datasources are available in Grafana:
- Click Dashboards in the primary menu
- Click New and select Import in the drop-down menu
- Copy the dashboard JSON provided in the accordion below
- Paste the dashboard JSON text directly into the text area
- Click Import
- Save the dashboard
Dashboard
Dashboard
{
"annotations": {
"list": [
{
"builtIn": 1,
"datasource": {
"type": "grafana",
"uid": "-- Grafana --"
},
"enable": true,
"hide": true,
"iconColor": "rgba(0, 211, 255, 1)",
"name": "Annotations & Alerts",
"type": "dashboard"
}
]
},
"editable": true,
"fiscalYearStartMonth": 0,
"graphTooltip": 1,
"id": 0,
"links": [
{
"asDropdown": false,
"icon": "doc",
"includeVars": false,
"keepTime": false,
"tags": [
"GPU",
"AI"
],
"targetBlank": true,
"title": "Documentation",
"tooltip": "Documentation",
"type": "link",
"url": "https://grafana.com/docs/grafana-cloud/monitor-applications/ai-observability/"
},
{
"asDropdown": false,
"icon": "external link",
"includeVars": false,
"keepTime": false,
"tags": [],
"targetBlank": true,
"title": "OpenLIT Github",
"tooltip": "Github",
"type": "link",
"url": "https://github.com/openlit/openlit"
}
],
"panels": [
{
"fieldConfig": {
"defaults": {},
"overrides": []
},
"gridPos": {
"h": 4,
"w": 3,
"x": 0,
"y": 0
},
"id": 61,
"options": {
"code": {
"language": "plaintext",
"showLineNumbers": false,
"showMiniMap": false
},
"content": "<img\n src=\"https://grafana.com/media/docs/grafana-cloud/ai-observability/aio11y-logo.svg\"\n width=\"100%\"\n height=\"100%\">",
"mode": "html"
},
"pluginVersion": "12.2.0",
"title": "",
"transparent": true,
"type": "text"
},
{
"datasource": {
"type": "prometheus",
"uid": "${metrics_datasource}"
},
"description": "This panel displays the current LLM request rate showing the number of GenAI requests per second across all services. This metric helps monitor system load and demand patterns for capacity planning.",
"fieldConfig": {
"defaults": {
"color": {
"fixedColor": "blue",
"mode": "palette-classic-by-name"
},
"mappings": [],
"thresholds": {
"mode": "absolute",
"steps": [
{
"color": "red",
"value": 0
},
{
"color": "#EAB839",
"value": 10
},
{
"color": "#6ED0E0",
"value": 100
}
]
},
"unit": "none"
},
"overrides": []
},
"gridPos": {
"h": 4,
"w": 5,
"x": 4,
"y": 0
},
"id": 22,
"options": {
"colorMode": "background",
"graphMode": "area",
"justifyMode": "auto",
"orientation": "auto",
"percentChangeColorMode": "standard",
"reduceOptions": {
"calcs": [
"lastNotNull"
],
"fields": "",
"values": false
},
"showPercentChange": false,
"textMode": "value_and_name",
"wideLayout": true
},
"pluginVersion": "12.2.0",
"targets": [
{
"datasource": {
"type": "prometheus",
"uid": "${metrics_datasource}"
},
"disableTextWrap": false,
"editorMode": "code",
"expr": "sum(increase(gen_ai_client_operation_duration_seconds_count{telemetry_sdk_name=\"openlit\", service_name=~\"$service_name\", deployment_environment=~\"$deployment_environment\"}[$__range]))",
"fullMetaSearch": false,
"includeNullMetadata": true,
"instant": false,
"legendFormat": "Total Requests",
"range": true,
"refId": "A",
"useBackend": false
}
],
"title": "",
"transparent": true,
"type": "stat"
},
{
"datasource": {
"type": "prometheus",
"uid": "${metrics_datasource}"
},
"description": "This panel displays the total number of tokens consumed by GenAI requests, providing a direct measure of usage volume. Monitoring this helps in assessing demand on GenAI services and guiding resource allocation strategies.",
"fieldConfig": {
"defaults": {
"color": {
"fixedColor": "purple",
"mode": "shades"
},
"mappings": [],
"thresholds": {
"mode": "absolute",
"steps": [
{
"color": "green",
"value": 0
},
{
"color": "red",
"value": 80
}
]
},
"unit": "short"
},
"overrides": []
},
"gridPos": {
"h": 4,
"w": 5,
"x": 9,
"y": 0
},
"id": 3,
"options": {
"colorMode": "background",
"graphMode": "area",
"justifyMode": "auto",
"orientation": "auto",
"percentChangeColorMode": "standard",
"reduceOptions": {
"calcs": [
"lastNotNull"
],
"fields": "",
"values": false
},
"showPercentChange": false,
"textMode": "auto",
"wideLayout": true
},
"pluginVersion": "12.2.0",
"targets": [
{
"datasource": {
"type": "prometheus",
"uid": "${metrics_datasource}"
},
"disableTextWrap": false,
"editorMode": "code",
"expr": "sum(increase(gen_ai_client_token_usage_sum{telemetry_sdk_name=\"openlit\", service_name=~\"$service_name\", deployment_environment=~\"$deployment_environment\"}[$__range]))",
"fullMetaSearch": false,
"includeNullMetadata": true,
"instant": false,
"legendFormat": "Total Usage Tokens",
"range": true,
"refId": "A",
"useBackend": false
}
],
"title": "",
"transparent": true,
"type": "stat"
},
{
"datasource": {
"type": "prometheus",
"uid": "${metrics_datasource}"
},
"description": "This panel displays the average cost per use of the GenAI models and related services. It provides insights into the cost-effectiveness of interactions with GenAI, helping to identify trends in expense per operation.",
"fieldConfig": {
"defaults": {
"color": {
"fixedColor": "blue",
"mode": "shades"
},
"mappings": [],
"thresholds": {
"mode": "absolute",
"steps": [
{
"color": "green",
"value": 0
},
{
"color": "#EAB839",
"value": 0.5
},
{
"color": "red",
"value": 1
}
]
},
"unit": "currencyUSD"
},
"overrides": []
},
"gridPos": {
"h": 4,
"w": 5,
"x": 14,
"y": 0
},
"id": 5,
"options": {
"colorMode": "background",
"graphMode": "area",
"justifyMode": "auto",
"orientation": "auto",
"percentChangeColorMode": "inverted",
"reduceOptions": {
"calcs": [
"lastNotNull"
],
"fields": "",
"values": false
},
"showPercentChange": false,
"textMode": "auto",
"wideLayout": true
},
"pluginVersion": "12.2.0",
"targets": [
{
"datasource": {
"type": "prometheus",
"uid": "${metrics_datasource}"
},
"disableTextWrap": false,
"editorMode": "code",
"expr": "sum(last_over_time(gen_ai_usage_cost_USD_sum{telemetry_sdk_name=\"openlit\", service_name=~\"$service_name\", deployment_environment=~\"$deployment_environment\"}[$__interval])) \n/ \n(sum(last_over_time(gen_ai_usage_cost_USD_count{telemetry_sdk_name=\"openlit\", service_name=~\"$service_name\", deployment_environment=~\"$deployment_environment\"}[$__interval])))",
"fullMetaSearch": false,
"includeNullMetadata": true,
"instant": false,
"legendFormat": "Avg Usage Cost",
"range": true,
"refId": "A",
"useBackend": false
}
],
"title": "",
"transparent": true,
"type": "stat"
},
{
"datasource": {
"type": "prometheus",
"uid": "${metrics_datasource}"
},
"description": "This panel displays the total cost incurred from using GenAI models. It reflects the financial impact of operational activities, offering insights into budgetary allocation and efficiency. Tracking this helps in effective cost management and financial planning for GenAI usage.",
"fieldConfig": {
"defaults": {
"color": {
"fixedColor": "blue",
"mode": "shades"
},
"mappings": [],
"thresholds": {
"mode": "absolute",
"steps": [
{
"color": "green",
"value": 0
},
{
"color": "red",
"value": 80
}
]
},
"unit": "currencyUSD"
},
"overrides": []
},
"gridPos": {
"h": 4,
"w": 5,
"x": 19,
"y": 0
},
"id": 2,
"options": {
"colorMode": "background",
"graphMode": "area",
"justifyMode": "auto",
"orientation": "auto",
"percentChangeColorMode": "standard",
"reduceOptions": {
"calcs": [
"lastNotNull"
],
"fields": "",
"values": false
},
"showPercentChange": false,
"textMode": "auto",
"wideLayout": true
},
"pluginVersion": "12.2.0",
"targets": [
{
"datasource": {
"type": "prometheus",
"uid": "${metrics_datasource}"
},
"disableTextWrap": false,
"editorMode": "code",
"expr": "sum(last_over_time(gen_ai_usage_cost_USD_sum{telemetry_sdk_name=\"openlit\", service_name=~\"$service_name\", deployment_environment=~\"$deployment_environment\"}[$__interval]))",
"fullMetaSearch": false,
"includeNullMetadata": true,
"instant": false,
"legendFormat": "Total Usage Cost",
"range": true,
"refId": "A",
"useBackend": false
}
],
"title": "",
"transparent": true,
"type": "stat"
},
{
"datasource": {
"type": "prometheus",
"uid": "${metrics_datasource}"
},
"description": "Hourly cost trends to identify spending patterns",
"fieldConfig": {
"defaults": {
"color": {
"mode": "palette-classic"
},
"custom": {
"axisBorderShow": false,
"axisCenteredZero": false,
"axisColorMode": "text",
"axisLabel": "",
"axisPlacement": "auto",
"barAlignment": 0,
"barWidthFactor": 0.6,
"drawStyle": "line",
"fillOpacity": 100,
"gradientMode": "opacity",
"hideFrom": {
"legend": false,
"tooltip": false,
"viz": false
},
"insertNulls": false,
"lineInterpolation": "linear",
"lineWidth": 2,
"pointSize": 5,
"scaleDistribution": {
"type": "linear"
},
"showPoints": "auto",
"showValues": false,
"spanNulls": false,
"stacking": {
"group": "A",
"mode": "none"
},
"thresholdsStyle": {
"mode": "off"
}
},
"mappings": [],
"min": 0,
"thresholds": {
"mode": "absolute",
"steps": [
{
"color": "green",
"value": 0
},
{
"color": "red",
"value": 80
}
]
},
"unit": "currencyUSD"
},
"overrides": []
},
"gridPos": {
"h": 7,
"w": 12,
"x": 0,
"y": 4
},
"id": 55,
"options": {
"annotations": {
"multiLane": false
},
"legend": {
"calcs": [],
"displayMode": "list",
"placement": "bottom",
"showLegend": true
},
"tooltip": {
"hideZeros": true,
"mode": "multi",
"sort": "none"
}
},
"pluginVersion": "12.2.0",
"targets": [
{
"datasource": {
"type": "prometheus",
"uid": "${metrics_datasource}"
},
"editorMode": "code",
"expr": "increase(gen_ai_usage_cost_USD_sum{telemetry_sdk_name=\"openlit\", service_name=~\"$service_name\", deployment_environment=~\"$deployment_environment\"}[1h]) / 1000",
"legendFormat": "{{gen_ai_provider_name}} / {{gen_ai_request_model}}",
"range": true,
"refId": "A"
}
],
"title": "Cost Trend Analysis",
"type": "timeseries"
},
{
"datasource": {
"type": "prometheus",
"uid": "${metrics_datasource}"
},
"description": "Percentage of successful GenAI requests over time",
"fieldConfig": {
"defaults": {
"color": {
"mode": "palette-classic"
},
"custom": {
"axisBorderShow": false,
"axisCenteredZero": false,
"axisColorMode": "text",
"axisLabel": "",
"axisPlacement": "auto",
"barAlignment": 0,
"barWidthFactor": 0.6,
"drawStyle": "line",
"fillOpacity": 100,
"gradientMode": "opacity",
"hideFrom": {
"legend": false,
"tooltip": false,
"viz": false
},
"insertNulls": false,
"lineInterpolation": "linear",
"lineWidth": 2,
"pointSize": 5,
"scaleDistribution": {
"type": "linear"
},
"showPoints": "auto",
"showValues": false,
"spanNulls": false,
"stacking": {
"group": "A",
"mode": "none"
},
"thresholdsStyle": {
"mode": "off"
}
},
"mappings": [],
"min": 0,
"thresholds": {
"mode": "absolute",
"steps": [
{
"color": "green",
"value": 0
},
{
"color": "red",
"value": 80
}
]
},
"unit": "percent"
},
"overrides": []
},
"gridPos": {
"h": 4,
"w": 12,
"x": 12,
"y": 4
},
"id": 56,
"options": {
"annotations": {
"multiLane": false
},
"legend": {
"calcs": [],
"displayMode": "list",
"placement": "bottom",
"showLegend": true
},
"tooltip": {
"hideZeros": false,
"mode": "multi",
"sort": "none"
}
},
"pluginVersion": "12.2.0",
"targets": [
{
"datasource": {
"type": "prometheus",
"uid": "${metrics_datasource}"
},
"editorMode": "code",
"expr": "sum(rate(gen_ai_client_operation_duration_seconds_count{http_status_code!~\"4..|5..\", telemetry_sdk_name=\"openlit\", service_name=~\"$service_name\", deployment_environment=~\"$deployment_environment\"}[$__rate_interval])) / sum(rate(gen_ai_client_operation_duration_seconds_count{telemetry_sdk_name=\"openlit\", service_name=~\"$service_name\", deployment_environment=~\"$deployment_environment\"}[$__rate_interval])) * 100",
"hide": true,
"legendFormat": "Total Requests",
"range": true,
"refId": "A"
},
{
"datasource": {
"type": "prometheus",
"uid": "${metrics_datasource}"
},
"editorMode": "code",
"expr": "( \n sum(increase(gen_ai_client_operation_duration_seconds_count{telemetry_sdk_name=\"openlit\", service_name=~\"$service_name\", deployment_environment=~\"$deployment_environment\"}[$__rate_interval])) \n - \n (sum(increase(gen_ai_client_operation_duration_seconds_count{error_type=~\".+\", telemetry_sdk_name=\"openlit\", service_name=~\"$service_name\", deployment_environment=~\"$deployment_environment\"}[$__rate_interval])) or vector(0)) \n) \n/ \nsum(increase(gen_ai_client_operation_duration_seconds_count{telemetry_sdk_name=\"openlit\", service_name=~\"$service_name\", deployment_environment=~\"$deployment_environment\"}[$__rate_interval])) \n* 100 ",
"hide": true,
"instant": false,
"legendFormat": "__auto",
"range": true,
"refId": "B"
},
{
"datasource": {
"type": "prometheus",
"uid": "${metrics_datasource}"
},
"editorMode": "code",
"expr": "sum(increase(gen_ai_client_operation_duration_seconds_count{telemetry_sdk_name=\"openlit\", error_type=~\".+\", service_name=~\"$service_name\", deployment_environment=~\"$deployment_environment\"}[$__rate_interval])) \n/ \nsum(increase(gen_ai_client_operation_duration_seconds_count{telemetry_sdk_name=\"openlit\", service_name=~\"$service_name\", deployment_environment=~\"$deployment_environment\"}[$__rate_interval])) \n* 100 ",
"instant": false,
"legendFormat": "__auto",
"range": true,
"refId": "C"
},
{
"datasource": {
"type": "prometheus",
"uid": "${metrics_datasource}"
},
"editorMode": "code",
"expr": "histogram_quantile(0.95, sum by(le, gen_ai_provider_name) (rate(gen_ai_client_operation_duration_seconds_bucket{service_name=~\"$service_name\", deployment_environment=~\"$deployment_environment\"}[$__rate_interval]))) ",
"hide": true,
"instant": false,
"legendFormat": "{{gen_ai_provider_name}}",
"range": true,
"refId": "D"
}
],
"title": "Error Rate %",
"type": "timeseries"
},
{
"datasource": {
"type": "prometheus",
"uid": "${metrics_datasource}"
},
"description": "Top 5 GenAI models ranked by total request count",
"fieldConfig": {
"defaults": {
"color": {
"mode": "palette-classic"
},
"custom": {
"align": "left",
"cellOptions": {
"mode": "basic",
"type": "gauge"
},
"footer": {
"reducers": []
},
"inspect": false
},
"decimals": 0,
"mappings": [],
"min": 0,
"thresholds": {
"mode": "absolute",
"steps": [
{
"color": "green",
"value": 0
},
{
"color": "red",
"value": 80
}
]
},
"unit": "short"
},
"overrides": [
{
"matcher": {
"id": "byName",
"options": "Metric"
},
"properties": [
{
"id": "displayName",
"value": "Model"
},
{
"id": "custom.width",
"value": 150
},
{
"id": "custom.cellOptions",
"value": {
"type": "auto"
}
}
]
}
]
},
"gridPos": {
"h": 7,
"w": 12,
"x": 12,
"y": 8
},
"id": 65,
"options": {
"cellHeight": "md",
"frameIndex": 0,
"showHeader": true,
"sortBy": [
{
"desc": true,
"displayName": "Model"
}
]
},
"pluginVersion": "12.2.0",
"targets": [
{
"app": "grafana-assistant-app",
"datasource": {
"type": "prometheus",
"uid": "${metrics_datasource}"
},
"editorMode": "code",
"expr": "topk(5, sum by(gen_ai_request_model) (last_over_time(gen_ai_client_operation_duration_seconds_count{telemetry_sdk_name=\"openlit\", service_name=~\"$service_name\", deployment_environment=~\"$deployment_environment\"}[$__range])))",
"instant": true,
"legendFormat": "{{gen_ai_request_model}}",
"queryType": "instant",
"range": false,
"refId": "A"
}
],
"title": "Top 5 Models by Requests",
"transformations": [
{
"id": "seriesToRows",
"options": {}
},
{
"id": "organize",
"options": {
"excludeByName": {
"Time": true
},
"renameByName": {
"Metric": "Model",
"Value": "Requests"
}
}
}
],
"type": "table"
},
{
"datasource": {
"type": "prometheus",
"uid": "${metrics_datasource}"
},
"description": "This panel displays the current 95th percentile time to first token across GenAI systems. Time to first token is critical for streaming applications and real-time user interactions, representing the delay before content generation begins.",
"fieldConfig": {
"defaults": {
"color": {
"mode": "thresholds"
},
"mappings": [],
"thresholds": {
"mode": "absolute",
"steps": [
{
"color": "green",
"value": 0
},
{
"color": "yellow",
"value": 2
},
{
"color": "red",
"value": 5
}
]
},
"unit": "s"
},
"overrides": []
},
"gridPos": {
"h": 4,
"w": 12,
"x": 0,
"y": 11
},
"id": 58,
"options": {
"colorMode": "value",
"graphMode": "area",
"justifyMode": "auto",
"orientation": "auto",
"percentChangeColorMode": "standard",
"reduceOptions": {
"calcs": [
"lastNotNull"
],
"fields": "",
"values": false
},
"showPercentChange": false,
"textMode": "auto",
"wideLayout": true
},
"pluginVersion": "12.2.0",
"targets": [
{
"datasource": {
"type": "prometheus",
"uid": "${metrics_datasource}"
},
"editorMode": "code",
"expr": "histogram_quantile(0.95, sum by (le, gen_ai_provider_name) (rate(gen_ai_server_time_to_first_token_seconds_bucket{telemetry_sdk_name=\"openlit\", service_name=~\"$service_name\", deployment_environment=~\"$deployment_environment\"}[$__rate_interval])))",
"legendFormat": "{{gen_ai_provider_name}} P95",
"range": true,
"refId": "A"
}
],
"title": "Time to First Token",
"type": "stat"
},
{
"datasource": {
"type": "prometheus",
"uid": "${metrics_datasource}"
},
"description": "Requests per second broken down by AI provider and model, derived from operation duration counter",
"fieldConfig": {
"defaults": {
"color": {
"mode": "palette-classic"
},
"custom": {
"axisBorderShow": false,
"axisCenteredZero": false,
"axisColorMode": "text",
"axisLabel": "",
"axisPlacement": "auto",
"barAlignment": 0,
"barWidthFactor": 0.6,
"drawStyle": "line",
"fillOpacity": 100,
"gradientMode": "opacity",
"hideFrom": {
"legend": false,
"tooltip": false,
"viz": false
},
"insertNulls": false,
"lineInterpolation": "smooth",
"lineWidth": 2,
"pointSize": 5,
"scaleDistribution": {
"type": "linear"
},
"showPoints": "auto",
"showValues": false,
"spanNulls": true,
"stacking": {
"group": "A",
"mode": "none"
},
"thresholdsStyle": {
"mode": "off"
}
},
"mappings": [],
"thresholds": {
"mode": "absolute",
"steps": [
{
"color": "green",
"value": 0
},
{
"color": "red",
"value": 80
}
]
},
"unit": "reqps"
},
"overrides": []
},
"gridPos": {
"h": 10,
"w": 24,
"x": 0,
"y": 15
},
"id": 64,
"options": {
"annotations": {
"multiLane": false
},
"legend": {
"calcs": [
"mean",
"max",
"lastNotNull"
],
"displayMode": "table",
"placement": "bottom",
"showLegend": true
},
"tooltip": {
"hideZeros": false,
"mode": "multi",
"sort": "desc"
}
},
"pluginVersion": "12.2.0",
"targets": [
{
"app": "grafana-assistant-app",
"datasource": {
"type": "prometheus",
"uid": "${metrics_datasource}"
},
"editorMode": "code",
"expr": "sum by(gen_ai_provider_name, gen_ai_request_model) (rate(gen_ai_client_operation_duration_seconds_count[$__rate_interval]))",
"instant": false,
"legendFormat": "{{gen_ai_provider_name}} / {{gen_ai_request_model}}",
"queryType": "range",
"range": true,
"refId": "A"
}
],
"title": "Request Rate by Platform & Model",
"transparent": true,
"type": "timeseries"
},
{
"datasource": {
"type": "prometheus",
"uid": "${metrics_datasource}"
},
"description": "This panel displays a comparative graph showing the average number of tokens consumed for completions and prompts against the average usage cost. It provides a visual representation of the relationship between the volume of data processed (in tokens) and the financial implications of using GenAI services. Analyzing this comparison helps in assessing cost-effectiveness and guiding strategic decisions for efficient resource utilization.",
"fieldConfig": {
"defaults": {
"color": {
"mode": "palette-classic"
},
"custom": {
"axisBorderShow": false,
"axisCenteredZero": false,
"axisColorMode": "text",
"axisLabel": "",
"axisPlacement": "auto",
"barAlignment": 0,
"barWidthFactor": 0.6,
"drawStyle": "bars",
"fillOpacity": 100,
"gradientMode": "opacity",
"hideFrom": {
"legend": false,
"tooltip": false,
"viz": false
},
"insertNulls": false,
"lineInterpolation": "smooth",
"lineStyle": {
"fill": "solid"
},
"lineWidth": 2,
"pointSize": 5,
"scaleDistribution": {
"type": "linear"
},
"showPoints": "always",
"showValues": false,
"spanNulls": true,
"stacking": {
"group": "A",
"mode": "normal"
},
"thresholdsStyle": {
"mode": "off"
}
},
"mappings": [],
"thresholds": {
"mode": "absolute",
"steps": [
{
"color": "green",
"value": 0
},
{
"color": "red",
"value": 80
}
]
},
"unit": "none"
},
"overrides": []
},
"gridPos": {
"h": 6,
"w": 24,
"x": 0,
"y": 25
},
"id": 6,
"options": {
"annotations": {
"multiLane": false
},
"legend": {
"calcs": [],
"displayMode": "list",
"placement": "bottom",
"showLegend": true
},
"tooltip": {
"hideZeros": false,
"mode": "single",
"sort": "none"
}
},
"pluginVersion": "12.2.0",
"targets": [
{
"datasource": {
"type": "prometheus",
"uid": "${metrics_datasource}"
},
"disableTextWrap": false,
"editorMode": "code",
"expr": "avg(gen_ai_client_token_usage_bucket{telemetry_sdk_name=\"openlit\", service_name=~\"$service_name\", deployment_environment=~\"$deployment_environment\", gen_ai_token_type=\"input\"})",
"fullMetaSearch": false,
"includeNullMetadata": true,
"instant": false,
"legendFormat": "Prompt Tokens",
"range": true,
"refId": "A",
"useBackend": false
},
{
"datasource": {
"type": "prometheus",
"uid": "${metrics_datasource}"
},
"disableTextWrap": false,
"editorMode": "code",
"expr": "avg(gen_ai_client_token_usage_bucket{telemetry_sdk_name=\"openlit\", service_name=~\"$service_name\", deployment_environment=~\"$deployment_environment\", gen_ai_token_type=\"output\"})",
"fullMetaSearch": false,
"includeNullMetadata": true,
"instant": false,
"legendFormat": "Completion Tokens",
"range": true,
"refId": "B",
"useBackend": false
},
{
"datasource": {
"type": "prometheus",
"uid": "${metrics_datasource}"
},
"disableTextWrap": false,
"editorMode": "code",
"expr": "avg(gen_ai_usage_cost_USD_bucket{telemetry_sdk_name=\"openlit\", service_name=~\"$service_name\", deployment_environment=~\"$deployment_environment\"})",
"fullMetaSearch": false,
"includeNullMetadata": true,
"instant": false,
"legendFormat": "Usage Cost",
"range": true,
"refId": "C",
"useBackend": false
}
],
"title": "Average Token Consumption vs. Average Usage Cost Comparison",
"transparent": true,
"type": "timeseries"
},
{
"collapsed": false,
"gridPos": {
"h": 1,
"w": 24,
"x": 0,
"y": 31
},
"id": 47,
"panels": [],
"title": "Requests",
"type": "row"
},
{
"datasource": {
"type": "loki",
"uid": "${logs_datasource}"
},
"fieldConfig": {
"defaults": {},
"overrides": []
},
"gridPos": {
"h": 17,
"w": 24,
"x": 0,
"y": 32
},
"id": 71,
"options": {
"dedupStrategy": "none",
"detailsMode": "sidebar",
"enableInfiniteScrolling": true,
"enableLogDetails": true,
"fontSize": "default",
"prettifyLogMessage": false,
"showCommonLabels": false,
"showControls": false,
"showFieldSelector": false,
"showLabels": true,
"showLevel": true,
"showTime": true,
"sortOrder": "Descending",
"syntaxHighlighting": true,
"timestampResolution": "ms",
"unwrappedColumns": false,
"wrapLogMessage": true
},
"pluginVersion": "12.2.0",
"targets": [
{
"datasource": {
"type": "loki",
"uid": "${logs_datasource}"
},
"direction": "backward",
"editorMode": "code",
"expr": "service.name: $service_name AND deployment.environment: $deployment_environment",
"queryType": "range",
"refId": "A"
}
],
"title": "",
"transparent": true,
"type": "logs"
},
{
"collapsed": false,
"gridPos": {
"h": 1,
"w": 24,
"x": 0,
"y": 49
},
"id": 31,
"panels": [],
"title": "Cost",
"type": "row"
},
{
"datasource": {
"type": "prometheus",
"uid": "${metrics_datasource}"
},
"description": "Top 5 GenAI providers ranked by total cost in USD",
"fieldConfig": {
"defaults": {
"color": {
"mode": "palette-classic"
},
"custom": {
"align": "left",
"cellOptions": {
"mode": "basic",
"type": "gauge"
},
"footer": {
"reducers": []
},
"inspect": false
},
"decimals": 4,
"mappings": [],
"min": 0,
"thresholds": {
"mode": "absolute",
"steps": [
{
"color": "green",
"value": 0
},
{
"color": "red",
"value": 80
}
]
},
"unit": "currencyUSD"
},
"overrides": [
{
"matcher": {
"id": "byName",
"options": "Metric"
},
"properties": [
{
"id": "displayName",
"value": "Model"
},
{
"id": "custom.width",
"value": 150
},
{
"id": "custom.cellOptions",
"value": {
"type": "auto"
}
}
]
}
]
},
"gridPos": {
"h": 8,
"w": 12,
"x": 0,
"y": 50
},
"id": 67,
"options": {
"cellHeight": "md",
"frameIndex": 0,
"showHeader": true,
"sortBy": [
{
"desc": true,
"displayName": "Last *"
}
]
},
"pluginVersion": "12.2.0",
"targets": [
{
"app": "grafana-assistant-app",
"datasource": {
"type": "prometheus",
"uid": "${metrics_datasource}"
},
"editorMode": "code",
"expr": "topk(5, sum by(gen_ai_provider_name) (last_over_time(gen_ai_usage_cost_USD_sum{telemetry_sdk_name=\"openlit\", service_name=~\"$service_name\", deployment_environment=~\"$deployment_environment\"}[$__range])))",
"instant": true,
"legendFormat": "{{gen_ai_provider_name}}",
"queryType": "instant",
"range": false,
"refId": "A"
}
],
"title": "Top 5 Providers by Cost",
"transformations": [
{
"id": "seriesToRows",
"options": {}
},
{
"id": "organize",
"options": {
"excludeByName": {
"Time": true
},
"renameByName": {
"Metric": "Model",
"Value": "Cost (USD)"
}
}
}
],
"type": "table"
},
{
"datasource": {
"type": "prometheus",
"uid": "${metrics_datasource}"
},
"description": "Top 5 GenAI models ranked by total cost in USD",
"fieldConfig": {
"defaults": {
"color": {
"mode": "palette-classic"
},
"custom": {
"align": "left",
"cellOptions": {
"mode": "basic",
"type": "gauge"
},
"footer": {
"reducers": []
},
"inspect": false
},
"decimals": 4,
"mappings": [],
"min": 0,
"thresholds": {
"mode": "absolute",
"steps": [
{
"color": "green",
"value": 0
},
{
"color": "red",
"value": 80
}
]
},
"unit": "currencyUSD"
},
"overrides": [
{
"matcher": {
"id": "byName",
"options": "Metric"
},
"properties": [
{
"id": "displayName",
"value": "Model"
},
{
"id": "custom.width",
"value": 150
},
{
"id": "custom.cellOptions",
"value": {
"type": "auto"
}
}
]
}
]
},
"gridPos": {
"h": 8,
"w": 12,
"x": 12,
"y": 50
},
"id": 66,
"options": {
"cellHeight": "md",
"frameIndex": 0,
"showHeader": true,
"sortBy": [
{
"desc": true,
"displayName": "Last *"
}
]
},
"pluginVersion": "12.2.0",
"targets": [
{
"app": "grafana-assistant-app",
"datasource": {
"type": "prometheus",
"uid": "${metrics_datasource}"
},
"editorMode": "builder",
"expr": "topk(5, sum by(gen_ai_request_model) (last_over_time(gen_ai_usage_cost_USD_sum{telemetry_sdk_name=\"openlit\", service_name=~\"$service_name\", deployment_environment=~\"$deployment_environment\"}[$__range])))",
"instant": true,
"legendFormat": "{{gen_ai_request_model}}",
"queryType": "instant",
"range": false,
"refId": "A"
}
],
"title": "Top 5 Models by Cost",
"transformations": [
{
"id": "seriesToRows",
"options": {}
},
{
"id": "organize",
"options": {
"excludeByName": {
"Time": true
},
"renameByName": {
"Metric": "Model",
"Value": "Cost (USD)"
}
}
}
],
"type": "table"
},
{
"datasource": {
"type": "prometheus",
"uid": "${metrics_datasource}"
},
"description": "This panel displays the cumulative cost over time broken down by GenAI system (OpenAI, Anthropic, Cohere, etc.). It shows spending trends and helps identify which platforms are driving costs, enabling better budget planning and cost optimization strategies.",
"fieldConfig": {
"defaults": {
"color": {
"mode": "palette-classic"
},
"custom": {
"axisBorderShow": false,
"axisCenteredZero": false,
"axisColorMode": "text",
"axisLabel": "",
"axisPlacement": "auto",
"barAlignment": 0,
"barWidthFactor": 0.6,
"drawStyle": "line",
"fillOpacity": 100,
"gradientMode": "opacity",
"hideFrom": {
"legend": false,
"tooltip": false,
"viz": false
},
"insertNulls": false,
"lineInterpolation": "linear",
"lineWidth": 1,
"pointSize": 5,
"scaleDistribution": {
"type": "linear"
},
"showPoints": "auto",
"showValues": false,
"spanNulls": false,
"stacking": {
"group": "A",
"mode": "none"
},
"thresholdsStyle": {
"mode": "off"
}
},
"decimals": 4,
"mappings": [],
"min": 0,
"thresholds": {
"mode": "absolute",
"steps": [
{
"color": "green",
"value": 0
},
{
"color": "red",
"value": 80
}
]
},
"unit": "currencyUSD"
},
"overrides": [
{
"matcher": {
"id": "byName",
"options": "Total Cost"
},
"properties": [
{
"id": "custom.lineStyle",
"value": {
"dash": [
10,
10
],
"fill": "dash"
}
}
]
}
]
},
"gridPos": {
"h": 8,
"w": 12,
"x": 0,
"y": 58
},
"id": 29,
"options": {
"annotations": {
"multiLane": false
},
"legend": {
"calcs": [
"median"
],
"displayMode": "list",
"placement": "bottom",
"showLegend": true
},
"tooltip": {
"hideZeros": false,
"mode": "multi",
"sort": "none"
}
},
"pluginVersion": "12.2.0",
"targets": [
{
"datasource": {
"type": "prometheus",
"uid": "${metrics_datasource}"
},
"editorMode": "code",
"expr": "sum by(gen_ai_provider_name) (last_over_time(gen_ai_usage_cost_USD_sum{telemetry_sdk_name=\"openlit\", service_name=~\"$service_name\", deployment_environment=~\"$deployment_environment\"}[$__interval]))",
"legendFormat": "{{gen_ai_provider_name}}",
"range": true,
"refId": "A"
}
],
"title": "Total Cost By System",
"transparent": true,
"type": "timeseries"
},
{
"datasource": {
"type": "prometheus",
"uid": "${metrics_datasource}"
},
"description": "This panel displays the cost trends over time broken down by individual GenAI models. It helps track spending patterns for specific models and identify which models are driving costs, enabling model-level cost optimization and budget allocation.",
"fieldConfig": {
"defaults": {
"color": {
"mode": "palette-classic"
},
"custom": {
"axisBorderShow": false,
"axisCenteredZero": false,
"axisColorMode": "text",
"axisLabel": "",
"axisPlacement": "auto",
"barAlignment": 0,
"barWidthFactor": 0.6,
"drawStyle": "line",
"fillOpacity": 100,
"gradientMode": "opacity",
"hideFrom": {
"legend": false,
"tooltip": false,
"viz": false
},
"insertNulls": false,
"lineInterpolation": "linear",
"lineStyle": {
"fill": "solid"
},
"lineWidth": 1,
"pointSize": 5,
"scaleDistribution": {
"type": "linear"
},
"showPoints": "auto",
"showValues": false,
"spanNulls": false,
"stacking": {
"group": "A",
"mode": "none"
},
"thresholdsStyle": {
"mode": "off"
}
},
"decimals": 2,
"mappings": [],
"thresholds": {
"mode": "absolute",
"steps": [
{
"color": "green",
"value": 0
},
{
"color": "red",
"value": 80
}
]
},
"unit": "currencyUSD"
},
"overrides": []
},
"gridPos": {
"h": 8,
"w": 12,
"x": 12,
"y": 58
},
"id": 32,
"options": {
"annotations": {
"multiLane": false
},
"legend": {
"calcs": [
"median"
],
"displayMode": "list",
"placement": "bottom",
"showLegend": true
},
"tooltip": {
"hideZeros": false,
"mode": "multi",
"sort": "none"
}
},
"pluginVersion": "12.2.0",
"targets": [
{
"datasource": {
"type": "prometheus",
"uid": "${metrics_datasource}"
},
"editorMode": "code",
"expr": "sum(increase(gen_ai_usage_cost_USD_sum{telemetry_sdk_name=\"openlit\", service_name=~\"$service_name\", deployment_environment=~\"$deployment_environment\"}[$__rate_interval])) by(gen_ai_request_model) / 1000",
"legendFormat": "__auto",
"range": true,
"refId": "A"
}
],
"title": "Total Cost By Model",
"transparent": true,
"type": "timeseries"
},
{
"datasource": {
"type": "prometheus",
"uid": "${metrics_datasource}"
},
"description": "Distribution of requests across deployment environments",
"fieldConfig": {
"defaults": {
"color": {
"mode": "thresholds"
},
"decimals": 0,
"mappings": [],
"thresholds": {
"mode": "absolute",
"steps": [
{
"color": "green",
"value": 0
},
{
"color": "blue",
"value": 80
}
]
},
"unit": "short"
},
"overrides": []
},
"gridPos": {
"h": 6,
"w": 8,
"x": 0,
"y": 66
},
"id": 70,
"options": {
"colorMode": "background",
"graphMode": "area",
"justifyMode": "auto",
"orientation": "auto",
"percentChangeColorMode": "standard",
"reduceOptions": {
"calcs": [
"lastNotNull"
],
"fields": "",
"values": false
},
"showPercentChange": false,
"textMode": "value_and_name",
"wideLayout": true
},
"pluginVersion": "12.2.0",
"targets": [
{
"app": "grafana-assistant-app",
"datasource": {
"type": "prometheus",
"uid": "${metrics_datasource}"
},
"editorMode": "code",
"expr": "sum by(deployment_environment) (last_over_time(gen_ai_client_operation_duration_seconds_count{telemetry_sdk_name=\"openlit\", service_name=~\"$service_name\", deployment_environment=~\"$deployment_environment\"}[$__range]))",
"instant": true,
"legendFormat": "{{deployment_environment}}",
"queryType": "instant",
"range": false,
"refId": "A"
}
],
"title": "Requests by Environment",
"transparent": true,
"type": "stat"
},
{
"datasource": {
"type": "prometheus",
"uid": "${metrics_datasource}"
},
"description": "Distribution of requests across AI providers / platforms",
"fieldConfig": {
"defaults": {
"color": {
"fixedColor": "purple",
"mode": "shades"
},
"decimals": 0,
"mappings": [],
"thresholds": {
"mode": "absolute",
"steps": [
{
"color": "green",
"value": 0
}
]
},
"unit": "short"
},
"overrides": []
},
"gridPos": {
"h": 6,
"w": 8,
"x": 8,
"y": 66
},
"id": 69,
"options": {
"colorMode": "background",
"graphMode": "area",
"justifyMode": "auto",
"orientation": "auto",
"percentChangeColorMode": "standard",
"reduceOptions": {
"calcs": [
"lastNotNull"
],
"fields": "",
"values": false
},
"showPercentChange": false,
"textMode": "value_and_name",
"wideLayout": true
},
"pluginVersion": "12.2.0",
"targets": [
{
"app": "grafana-assistant-app",
"datasource": {
"type": "prometheus",
"uid": "${metrics_datasource}"
},
"editorMode": "code",
"expr": "sum by(gen_ai_provider_name) (last_over_time(gen_ai_client_operation_duration_seconds_count{telemetry_sdk_name=\"openlit\", service_name=~\"$service_name\", deployment_environment=~\"$deployment_environment\"}[$__range]))",
"instant": true,
"legendFormat": "{{gen_ai_provider_name}}",
"queryType": "instant",
"range": false,
"refId": "A"
}
],
"title": "Requests by Platform",
"transparent": true,
"type": "stat"
},
{
"datasource": {
"type": "prometheus",
"uid": "${metrics_datasource}"
},
"description": "Distribution of requests by GenAI operation type (chat, image, etc.)",
"fieldConfig": {
"defaults": {
"color": {
"fixedColor": "green",
"mode": "fixed"
},
"decimals": 0,
"mappings": [],
"thresholds": {
"mode": "absolute",
"steps": [
{
"color": "green",
"value": 0
},
{
"color": "red",
"value": 80
}
]
},
"unit": "short"
},
"overrides": []
},
"gridPos": {
"h": 6,
"w": 8,
"x": 16,
"y": 66
},
"id": 68,
"options": {
"colorMode": "background",
"graphMode": "area",
"justifyMode": "auto",
"orientation": "auto",
"percentChangeColorMode": "standard",
"reduceOptions": {
"calcs": [
"lastNotNull"
],
"fields": "",
"values": false
},
"showPercentChange": false,
"textMode": "value_and_name",
"wideLayout": true
},
"pluginVersion": "12.2.0",
"targets": [
{
"app": "grafana-assistant-app",
"datasource": {
"type": "prometheus",
"uid": "${metrics_datasource}"
},
"editorMode": "builder",
"expr": "sum by(gen_ai_operation_name) (last_over_time(gen_ai_client_operation_duration_seconds_count{telemetry_sdk_name=\"openlit\", service_name=~\"$service_name\", deployment_environment=~\"$deployment_environment\"}[$__range]))",
"instant": true,
"legendFormat": "{{gen_ai_operation_name}}",
"queryType": "instant",
"range": false,
"refId": "A"
}
],
"title": "Requests by Type",
"transparent": true,
"type": "stat"
},
{
"datasource": {
"type": "prometheus",
"uid": "${metrics_datasource}"
},
"description": "This panel displays the distribution of request durations grouped by GenAI system (OpenAI, Anthropic, Cohere, etc.). It highlights how long requests take to complete across different GenAI platforms, offering insights into platform-specific performance characteristics. Understanding this distribution helps in comparing system performance and identifying which GenAI platforms provide the best response times.",
"fieldConfig": {
"defaults": {
"custom": {
"hideFrom": {
"legend": false,
"tooltip": false,
"viz": false
},
"scaleDistribution": {
"type": "linear"
}
}
},
"overrides": []
},
"gridPos": {
"h": 8,
"w": 12,
"x": 0,
"y": 72
},
"id": 57,
"options": {
"annotations": {
"multiLane": false
},
"calculate": false,
"calculation": {
"xBuckets": {
"mode": "count",
"value": "10"
},
"yBuckets": {
"mode": "count",
"value": "10"
}
},
"cellGap": 1,
"color": {
"exponent": 0.5,
"fill": "dark-blue",
"mode": "spectrum",
"reverse": false,
"scale": "exponential",
"scheme": "Blues",
"steps": 128
},
"exemplars": {
"color": "rgba(255,0,255,0.7)"
},
"filterValues": {
"le": 1e-9
},
"legend": {
"show": false
},
"rowsFrame": {
"layout": "auto"
},
"tooltip": {
"mode": "single",
"showColorScale": false,
"yHistogram": false
},
"yAxis": {
"axisPlacement": "left",
"reverse": false,
"unit": "s"
}
},
"pluginVersion": "12.2.0",
"targets": [
{
"datasource": {
"type": "prometheus",
"uid": "${metrics_datasource}"
},
"editorMode": "code",
"expr": "histogram_quantile(0.95, sum(rate(gen_ai_client_operation_duration_seconds_bucket{telemetry_sdk_name=\"openlit\", service_name=~\"$service_name\", deployment_environment=~\"$deployment_environment\"}[$__rate_interval])) by (le, gen_ai_provider_name))",
"legendFormat": "{{gen_ai_provider_name}}",
"range": true,
"refId": "A"
}
],
"title": "Latency Distribution",
"transparent": true,
"type": "heatmap"
},
{
"datasource": {
"type": "prometheus",
"uid": "${metrics_datasource}"
},
"description": "This panel displays the 95th percentile latency distribution across models in a heatmap format. The intensity of colors represents the concentration of requests at different latency levels, helping identify performance patterns and outliers across different GenAI models.",
"fieldConfig": {
"defaults": {
"custom": {
"hideFrom": {
"legend": false,
"tooltip": false,
"viz": false
},
"scaleDistribution": {
"type": "linear"
}
}
},
"overrides": []
},
"gridPos": {
"h": 8,
"w": 12,
"x": 12,
"y": 72
},
"id": 53,
"options": {
"annotations": {
"multiLane": false
},
"calculate": false,
"calculation": {
"xBuckets": {
"mode": "count",
"value": "10"
},
"yBuckets": {
"mode": "count",
"value": "10"
}
},
"cellGap": 1,
"color": {
"exponent": 0.5,
"fill": "blue",
"mode": "scheme",
"reverse": false,
"scale": "exponential",
"scheme": "Purples",
"steps": 128
},
"exemplars": {
"color": "rgba(255,0,255,0.7)"
},
"filterValues": {
"le": 1e-9
},
"legend": {
"show": false
},
"rowsFrame": {
"layout": "auto"
},
"tooltip": {
"mode": "single",
"showColorScale": false,
"yHistogram": false
},
"yAxis": {
"axisPlacement": "left",
"reverse": false,
"unit": "none"
}
},
"pluginVersion": "12.2.0",
"targets": [
{
"datasource": {
"type": "prometheus",
"uid": "${metrics_datasource}"
},
"expr": "histogram_quantile(0.95, sum(rate(gen_ai_client_operation_duration_seconds_bucket{telemetry_sdk_name=\"openlit\", service_name=~\"$service_name\", deployment_environment=~\"$deployment_environment\"}[$__rate_interval])) by (le, gen_ai_request_model))",
"legendFormat": "{{gen_ai_request_model}}",
"range": true,
"refId": "A"
}
],
"title": "Latency Distribution",
"transparent": true,
"type": "heatmap"
},
{
"collapsed": false,
"gridPos": {
"h": 1,
"w": 24,
"x": 0,
"y": 80
},
"id": 46,
"panels": [],
"title": "Latency",
"type": "row"
},
{
"description": "This panel displays section header for system-level latency analysis. It provides visual separation between system-level and model-level latency breakdowns.",
"fieldConfig": {
"defaults": {},
"overrides": []
},
"gridPos": {
"h": 2,
"w": 12,
"x": 0,
"y": 81
},
"id": 59,
"options": {
"code": {
"language": "plaintext",
"showLineNumbers": false,
"showMiniMap": false
},
"content": "### By System",
"mode": "markdown"
},
"pluginVersion": "12.2.0",
"title": "",
"type": "text"
},
{
"description": "This panel displays section header for model-level latency analysis. It provides visual separation between system-level and model-level latency breakdowns.",
"fieldConfig": {
"defaults": {},
"overrides": []
},
"gridPos": {
"h": 2,
"w": 12,
"x": 12,
"y": 81
},
"id": 60,
"options": {
"code": {
"language": "plaintext",
"showLineNumbers": false,
"showMiniMap": false
},
"content": "### By Model",
"mode": "markdown"
},
"pluginVersion": "12.2.0",
"title": "",
"type": "text"
},
{
"datasource": {
"type": "prometheus",
"uid": "${metrics_datasource}"
},
"description": "This panel displays the 95th percentile token generation time by GenAI system as a horizontal bar chart. It provides platform-level performance comparison, helping identify which systems deliver the best response times.",
"fieldConfig": {
"defaults": {
"color": {
"mode": "continuous-GrYlRd"
},
"decimals": 2,
"mappings": [],
"min": 0,
"thresholds": {
"mode": "absolute",
"steps": [
{
"color": "green",
"value": 0
},
{
"color": "red",
"value": 80
}
]
},
"unit": "s"
},
"overrides": []
},
"gridPos": {
"h": 8,
"w": 12,
"x": 0,
"y": 83
},
"id": 38,
"options": {
"displayMode": "lcd",
"legend": {
"calcs": [],
"displayMode": "list",
"placement": "bottom",
"showLegend": false
},
"maxVizHeight": 300,
"minVizHeight": 16,
"minVizWidth": 8,
"namePlacement": "auto",
"orientation": "horizontal",
"reduceOptions": {
"calcs": [
"lastNotNull"
],
"fields": "",
"values": true
},
"showUnfilled": true,
"sizing": "auto",
"valueMode": "color"
},
"pluginVersion": "12.2.0",
"targets": [
{
"datasource": {
"type": "prometheus",
"uid": "${metrics_datasource}"
},
"disableTextWrap": false,
"editorMode": "code",
"exemplar": false,
"expr": "histogram_quantile(0.95, \n sum by(le, gen_ai_provider_name) (\n increase(gen_ai_client_operation_duration_seconds_bucket{telemetry_sdk_name=\"openlit\", service_name=~\"$service_name\", deployment_environment=~\"$deployment_environment\"}[$__range])\n )\n)",
"fullMetaSearch": false,
"includeNullMetadata": true,
"instant": true,
"legendFormat": "__auto",
"range": false,
"refId": "A",
"useBackend": false
}
],
"title": "Tokens Generation Duration (P95)",
"transformations": [
{
"id": "seriesToRows",
"options": {}
},
{
"id": "sortBy",
"options": {
"fields": {},
"sort": [
{
"desc": true,
"field": "Value"
}
]
}
}
],
"transparent": true,
"type": "bargauge"
},
{
"datasource": {
"type": "prometheus",
"uid": "${metrics_datasource}"
},
"description": "This panel shows the 95th percentile token generation time by model as a horizontal bar chart. It provides a clear ranking of model performance, helping identify the fastest and slowest models for response time optimization.",
"fieldConfig": {
"defaults": {
"color": {
"mode": "continuous-GrYlRd"
},
"decimals": 2,
"mappings": [],
"min": 0,
"thresholds": {
"mode": "absolute",
"steps": [
{
"color": "green",
"value": 0
},
{
"color": "red",
"value": 80
}
]
},
"unit": "s"
},
"overrides": []
},
"gridPos": {
"h": 8,
"w": 12,
"x": 12,
"y": 83
},
"id": 37,
"options": {
"displayMode": "lcd",
"legend": {
"calcs": [],
"displayMode": "list",
"placement": "bottom",
"showLegend": false
},
"maxVizHeight": 300,
"minVizHeight": 16,
"minVizWidth": 8,
"namePlacement": "auto",
"orientation": "horizontal",
"reduceOptions": {
"calcs": [
"lastNotNull"
],
"fields": "",
"values": true
},
"showUnfilled": true,
"sizing": "auto",
"valueMode": "color"
},
"pluginVersion": "12.2.0",
"targets": [
{
"datasource": {
"type": "prometheus",
"uid": "${metrics_datasource}"
},
"disableTextWrap": false,
"editorMode": "code",
"exemplar": false,
"expr": "histogram_quantile(0.95, \n sum by(le, gen_ai_request_model) (\n increase(gen_ai_client_operation_duration_seconds_bucket{telemetry_sdk_name=\"openlit\", service_name=~\"$service_name\", deployment_environment=~\"$deployment_environment\"}[$__range])\n )\n)",
"fullMetaSearch": false,
"includeNullMetadata": true,
"instant": true,
"legendFormat": "__auto",
"range": false,
"refId": "A",
"useBackend": false
}
],
"title": "Tokens Generation Duration (P95)",
"transformations": [
{
"id": "seriesToRows",
"options": {}
},
{
"id": "sortBy",
"options": {
"fields": {},
"sort": [
{
"desc": true,
"field": "Value"
}
]
}
}
],
"transparent": true,
"type": "bargauge"
},
{
"datasource": {
"type": "prometheus",
"uid": "${metrics_datasource}"
},
"description": "This panel displays the 95th percentile time to first token by GenAI system over time. Time to first token is critical for streaming applications and user experience, as it represents the initial response latency before content generation begins.",
"fieldConfig": {
"defaults": {
"color": {
"mode": "palette-classic"
},
"custom": {
"axisBorderShow": false,
"axisCenteredZero": false,
"axisColorMode": "text",
"axisLabel": "",
"axisPlacement": "auto",
"barAlignment": 0,
"barWidthFactor": 0.6,
"drawStyle": "line",
"fillOpacity": 0,
"gradientMode": "none",
"hideFrom": {
"legend": false,
"tooltip": false,
"viz": false
},
"insertNulls": false,
"lineInterpolation": "linear",
"lineWidth": 1,
"pointSize": 5,
"scaleDistribution": {
"type": "linear"
},
"showPoints": "auto",
"showValues": false,
"spanNulls": false,
"stacking": {
"group": "A",
"mode": "none"
},
"thresholdsStyle": {
"mode": "off"
}
},
"mappings": [],
"thresholds": {
"mode": "absolute",
"steps": [
{
"color": "green",
"value": 0
},
{
"color": "red",
"value": 80
}
]
},
"unit": "s"
},
"overrides": []
},
"gridPos": {
"h": 8,
"w": 12,
"x": 0,
"y": 91
},
"id": 41,
"options": {
"annotations": {
"multiLane": false
},
"legend": {
"calcs": [
"median"
],
"displayMode": "list",
"placement": "bottom",
"showLegend": true
},
"tooltip": {
"hideZeros": false,
"mode": "multi",
"sort": "none"
}
},
"pluginVersion": "12.2.0",
"targets": [
{
"datasource": {
"type": "prometheus",
"uid": "${metrics_datasource}"
},
"editorMode": "code",
"expr": "histogram_quantile(0.95, sum(rate(gen_ai_server_time_to_first_token_seconds_bucket{telemetry_sdk_name=\"openlit\", service_name=~\"$service_name\", deployment_environment=~\"$deployment_environment\"}[$__rate_interval])) by (gen_ai_provider_name, le))",
"legendFormat": "__auto",
"range": true,
"refId": "A"
}
],
"title": "Time to first token",
"transparent": true,
"type": "timeseries"
},
{
"datasource": {
"type": "prometheus",
"uid": "${metrics_datasource}"
},
"description": "This panel shows the 95th percentile time to first token by model over time. It helps identify which models provide the fastest initial response for streaming applications and real-time user interactions.",
"fieldConfig": {
"defaults": {
"color": {
"mode": "palette-classic"
},
"custom": {
"axisBorderShow": false,
"axisCenteredZero": false,
"axisColorMode": "text",
"axisLabel": "",
"axisPlacement": "auto",
"barAlignment": 0,
"barWidthFactor": 0.6,
"drawStyle": "line",
"fillOpacity": 0,
"gradientMode": "none",
"hideFrom": {
"legend": false,
"tooltip": false,
"viz": false
},
"insertNulls": false,
"lineInterpolation": "linear",
"lineWidth": 1,
"pointSize": 5,
"scaleDistribution": {
"type": "linear"
},
"showPoints": "auto",
"showValues": false,
"spanNulls": false,
"stacking": {
"group": "A",
"mode": "none"
},
"thresholdsStyle": {
"mode": "off"
}
},
"mappings": [],
"thresholds": {
"mode": "absolute",
"steps": [
{
"color": "green",
"value": 0
},
{
"color": "red",
"value": 80
}
]
},
"unit": "s"
},
"overrides": []
},
"gridPos": {
"h": 8,
"w": 12,
"x": 12,
"y": 91
},
"id": 42,
"options": {
"annotations": {
"multiLane": false
},
"legend": {
"calcs": [
"median"
],
"displayMode": "list",
"placement": "bottom",
"showLegend": true
},
"tooltip": {
"hideZeros": false,
"mode": "multi",
"sort": "none"
}
},
"pluginVersion": "12.2.0",
"targets": [
{
"datasource": {
"type": "prometheus",
"uid": "${metrics_datasource}"
},
"editorMode": "code",
"expr": "histogram_quantile(0.95, sum(rate(gen_ai_server_time_to_first_token_seconds_bucket{telemetry_sdk_name=\"openlit\", service_name=~\"$service_name\", deployment_environment=~\"$deployment_environment\"}[$__rate_interval])) by (gen_ai_request_model, le))",
"legendFormat": "__auto",
"range": true,
"refId": "A"
}
],
"title": "Time to first token",
"transparent": true,
"type": "timeseries"
},
{
"datasource": {
"type": "prometheus",
"uid": "${metrics_datasource}"
},
"description": "This panel displays the 95th percentile token generation time by GenAI system over time. It shows performance trends and helps monitor latency patterns across different platforms, enabling proactive performance management and system optimization.",
"fieldConfig": {
"defaults": {
"color": {
"mode": "palette-classic"
},
"custom": {
"axisBorderShow": false,
"axisCenteredZero": false,
"axisColorMode": "text",
"axisLabel": "",
"axisPlacement": "auto",
"barAlignment": 0,
"barWidthFactor": 0.6,
"drawStyle": "line",
"fillOpacity": 0,
"gradientMode": "none",
"hideFrom": {
"legend": false,
"tooltip": false,
"viz": false
},
"insertNulls": false,
"lineInterpolation": "linear",
"lineWidth": 1,
"pointSize": 5,
"scaleDistribution": {
"type": "linear"
},
"showPoints": "auto",
"showValues": false,
"spanNulls": false,
"stacking": {
"group": "A",
"mode": "none"
},
"thresholdsStyle": {
"mode": "off"
}
},
"mappings": [],
"thresholds": {
"mode": "absolute",
"steps": [
{
"color": "green",
"value": 0
},
{
"color": "red",
"value": 80
}
]
},
"unit": "s"
},
"overrides": []
},
"gridPos": {
"h": 9,
"w": 12,
"x": 0,
"y": 99
},
"id": 39,
"options": {
"annotations": {
"multiLane": false
},
"legend": {
"calcs": [
"median"
],
"displayMode": "list",
"placement": "bottom",
"showLegend": true
},
"tooltip": {
"hideZeros": false,
"mode": "multi",
"sort": "none"
}
},
"pluginVersion": "12.2.0",
"targets": [
{
"datasource": {
"type": "prometheus",
"uid": "${metrics_datasource}"
},
"editorMode": "code",
"expr": "histogram_quantile(0.95, sum(rate(gen_ai_client_operation_duration_seconds_bucket{telemetry_sdk_name=\"openlit\", service_name=~\"$service_name\", deployment_environment=~\"$deployment_environment\"}[$__rate_interval])) by (gen_ai_provider_name, le))",
"legendFormat": "__auto",
"range": true,
"refId": "A"
}
],
"title": "Tokens Generation Duration",
"transparent": true,
"type": "timeseries"
},
{
"datasource": {
"type": "prometheus",
"uid": "${metrics_datasource}"
},
"description": "This panel displays the 95th percentile token generation time by model over time. It provides detailed performance tracking for each model, enabling model-specific performance optimization and selection based on latency requirements.",
"fieldConfig": {
"defaults": {
"color": {
"mode": "palette-classic"
},
"custom": {
"axisBorderShow": false,
"axisCenteredZero": false,
"axisColorMode": "text",
"axisLabel": "",
"axisPlacement": "auto",
"barAlignment": 0,
"barWidthFactor": 0.6,
"drawStyle": "line",
"fillOpacity": 0,
"gradientMode": "none",
"hideFrom": {
"legend": false,
"tooltip": false,
"viz": false
},
"insertNulls": false,
"lineInterpolation": "linear",
"lineWidth": 1,
"pointSize": 5,
"scaleDistribution": {
"type": "linear"
},
"showPoints": "auto",
"showValues": false,
"spanNulls": false,
"stacking": {
"group": "A",
"mode": "none"
},
"thresholdsStyle": {
"mode": "off"
}
},
"mappings": [],
"thresholds": {
"mode": "absolute",
"steps": [
{
"color": "green",
"value": 0
},
{
"color": "red",
"value": 80
}
]
},
"unit": "s"
},
"overrides": []
},
"gridPos": {
"h": 9,
"w": 12,
"x": 12,
"y": 99
},
"id": 43,
"options": {
"annotations": {
"multiLane": false
},
"legend": {
"calcs": [
"median"
],
"displayMode": "list",
"placement": "bottom",
"showLegend": true
},
"tooltip": {
"hideZeros": false,
"mode": "single",
"sort": "none"
}
},
"pluginVersion": "12.2.0",
"targets": [
{
"datasource": {
"type": "prometheus",
"uid": "${metrics_datasource}"
},
"editorMode": "code",
"expr": "histogram_quantile(0.95, sum(rate(gen_ai_client_operation_duration_seconds_bucket{telemetry_sdk_name=\"openlit\", service_name=~\"$service_name\", deployment_environment=~\"$deployment_environment\"}[$__rate_interval])) by (gen_ai_request_model, le))",
"legendFormat": "__auto",
"range": true,
"refId": "A"
}
],
"title": "Tokens Generation Duration",
"transparent": true,
"type": "timeseries"
}
],
"preload": false,
"refresh": "30s",
"schemaVersion": 42,
"tags": [
"ai-observability-integration"
],
"templating": {
"list": [
{
"current": {
"text": "VictoriaMetrics",
"value": "P4169E866C3094E38"
},
"includeAll": false,
"label": "Metrics data source",
"name": "metrics_datasource",
"options": [],
"query": "victoriametrics-metrics-datasource",
"refresh": 1,
"regex": "",
"type": "datasource"
},
{
"current": {
"text": "VictoriaLogs",
"value": "PD775F2863313E6C7"
},
"includeAll": false,
"label": "Logs data source",
"name": "logs_datasource",
"options": [],
"query": "victoriametrics-logs-datasource",
"refresh": 1,
"regex": "",
"type": "datasource"
},
{
"current": {
"text": "All",
"value": [
"$__all"
]
},
"datasource": {
"type": "prometheus",
"uid": "${metrics_datasource}"
},
"definition": "label_values(service_name)",
"includeAll": true,
"label": "service_name",
"multi": true,
"name": "service_name",
"options": [],
"query": {
"qryType": 1,
"query": "label_values(service_name)",
"refId": "PrometheusVariableQueryEditor-VariableQuery"
},
"refresh": 2,
"regex": "",
"type": "query"
},
{
"current": {
"text": "All",
"value": [
"$__all"
]
},
"datasource": {
"type": "prometheus",
"uid": "${metrics_datasource}"
},
"definition": "label_values(deployment_environment)",
"includeAll": true,
"label": "deployment_environment",
"multi": true,
"name": "deployment_environment",
"options": [],
"query": {
"qryType": 1,
"query": "label_values(deployment_environment)",
"refId": "PrometheusVariableQueryEditor-VariableQuery"
},
"refresh": 2,
"regex": "",
"sort": 1,
"type": "query"
}
]
},
"time": {
"from": "now-15m",
"to": "now"
},
"timepicker": {},
"timezone": "browser",
"title": "GenAI Observability",
"uid": "cdiz9piuoa3ggc",
"version": 7
}