1. Get your Credentials
- Log into your Dynatrace environment
-
Generate an API Token:
- Go to Settings → Integration → API tokens
- Click Generate token
- Give it a name (e.g.,
openlit-token) - Enable these scopes:
openTelemetryTrace.ingest- for trace ingestionmetrics.ingest- for metrics ingestionlogs.ingest- for logs ingestion (optional)
- Click Generate and copy the token
-
Get your Environment ID:
- Your Dynatrace URL format:
https://{environment-id}.live.dynatrace.com - Extract the
{environment-id}part from your Dynatrace URL
- Your Dynatrace URL format:
-
Construct your OTLP endpoint:
- Format:
https://{environment-id}.live.dynatrace.com/api/v2/otlp - Example:
https://abc12345.live.dynatrace.com/api/v2/otlp
- Format:
2. Instrument your application
- SDK
- CLI
For direct integration into your Python applications:Replace:Refer to the OpenLIT Python SDK repository for more advanced configurations and use cases.
- Function Arguments
- Environment Variables
YOUR_ENVIRONMENT_IDwith your Dynatrace environment ID.- Example:
abc12345.live.dynatrace.com
- Example:
YOUR_DYNATRACE_API_TOKENwith the API token you generated in Step 1.
3. View your telemetry in Dynatrace
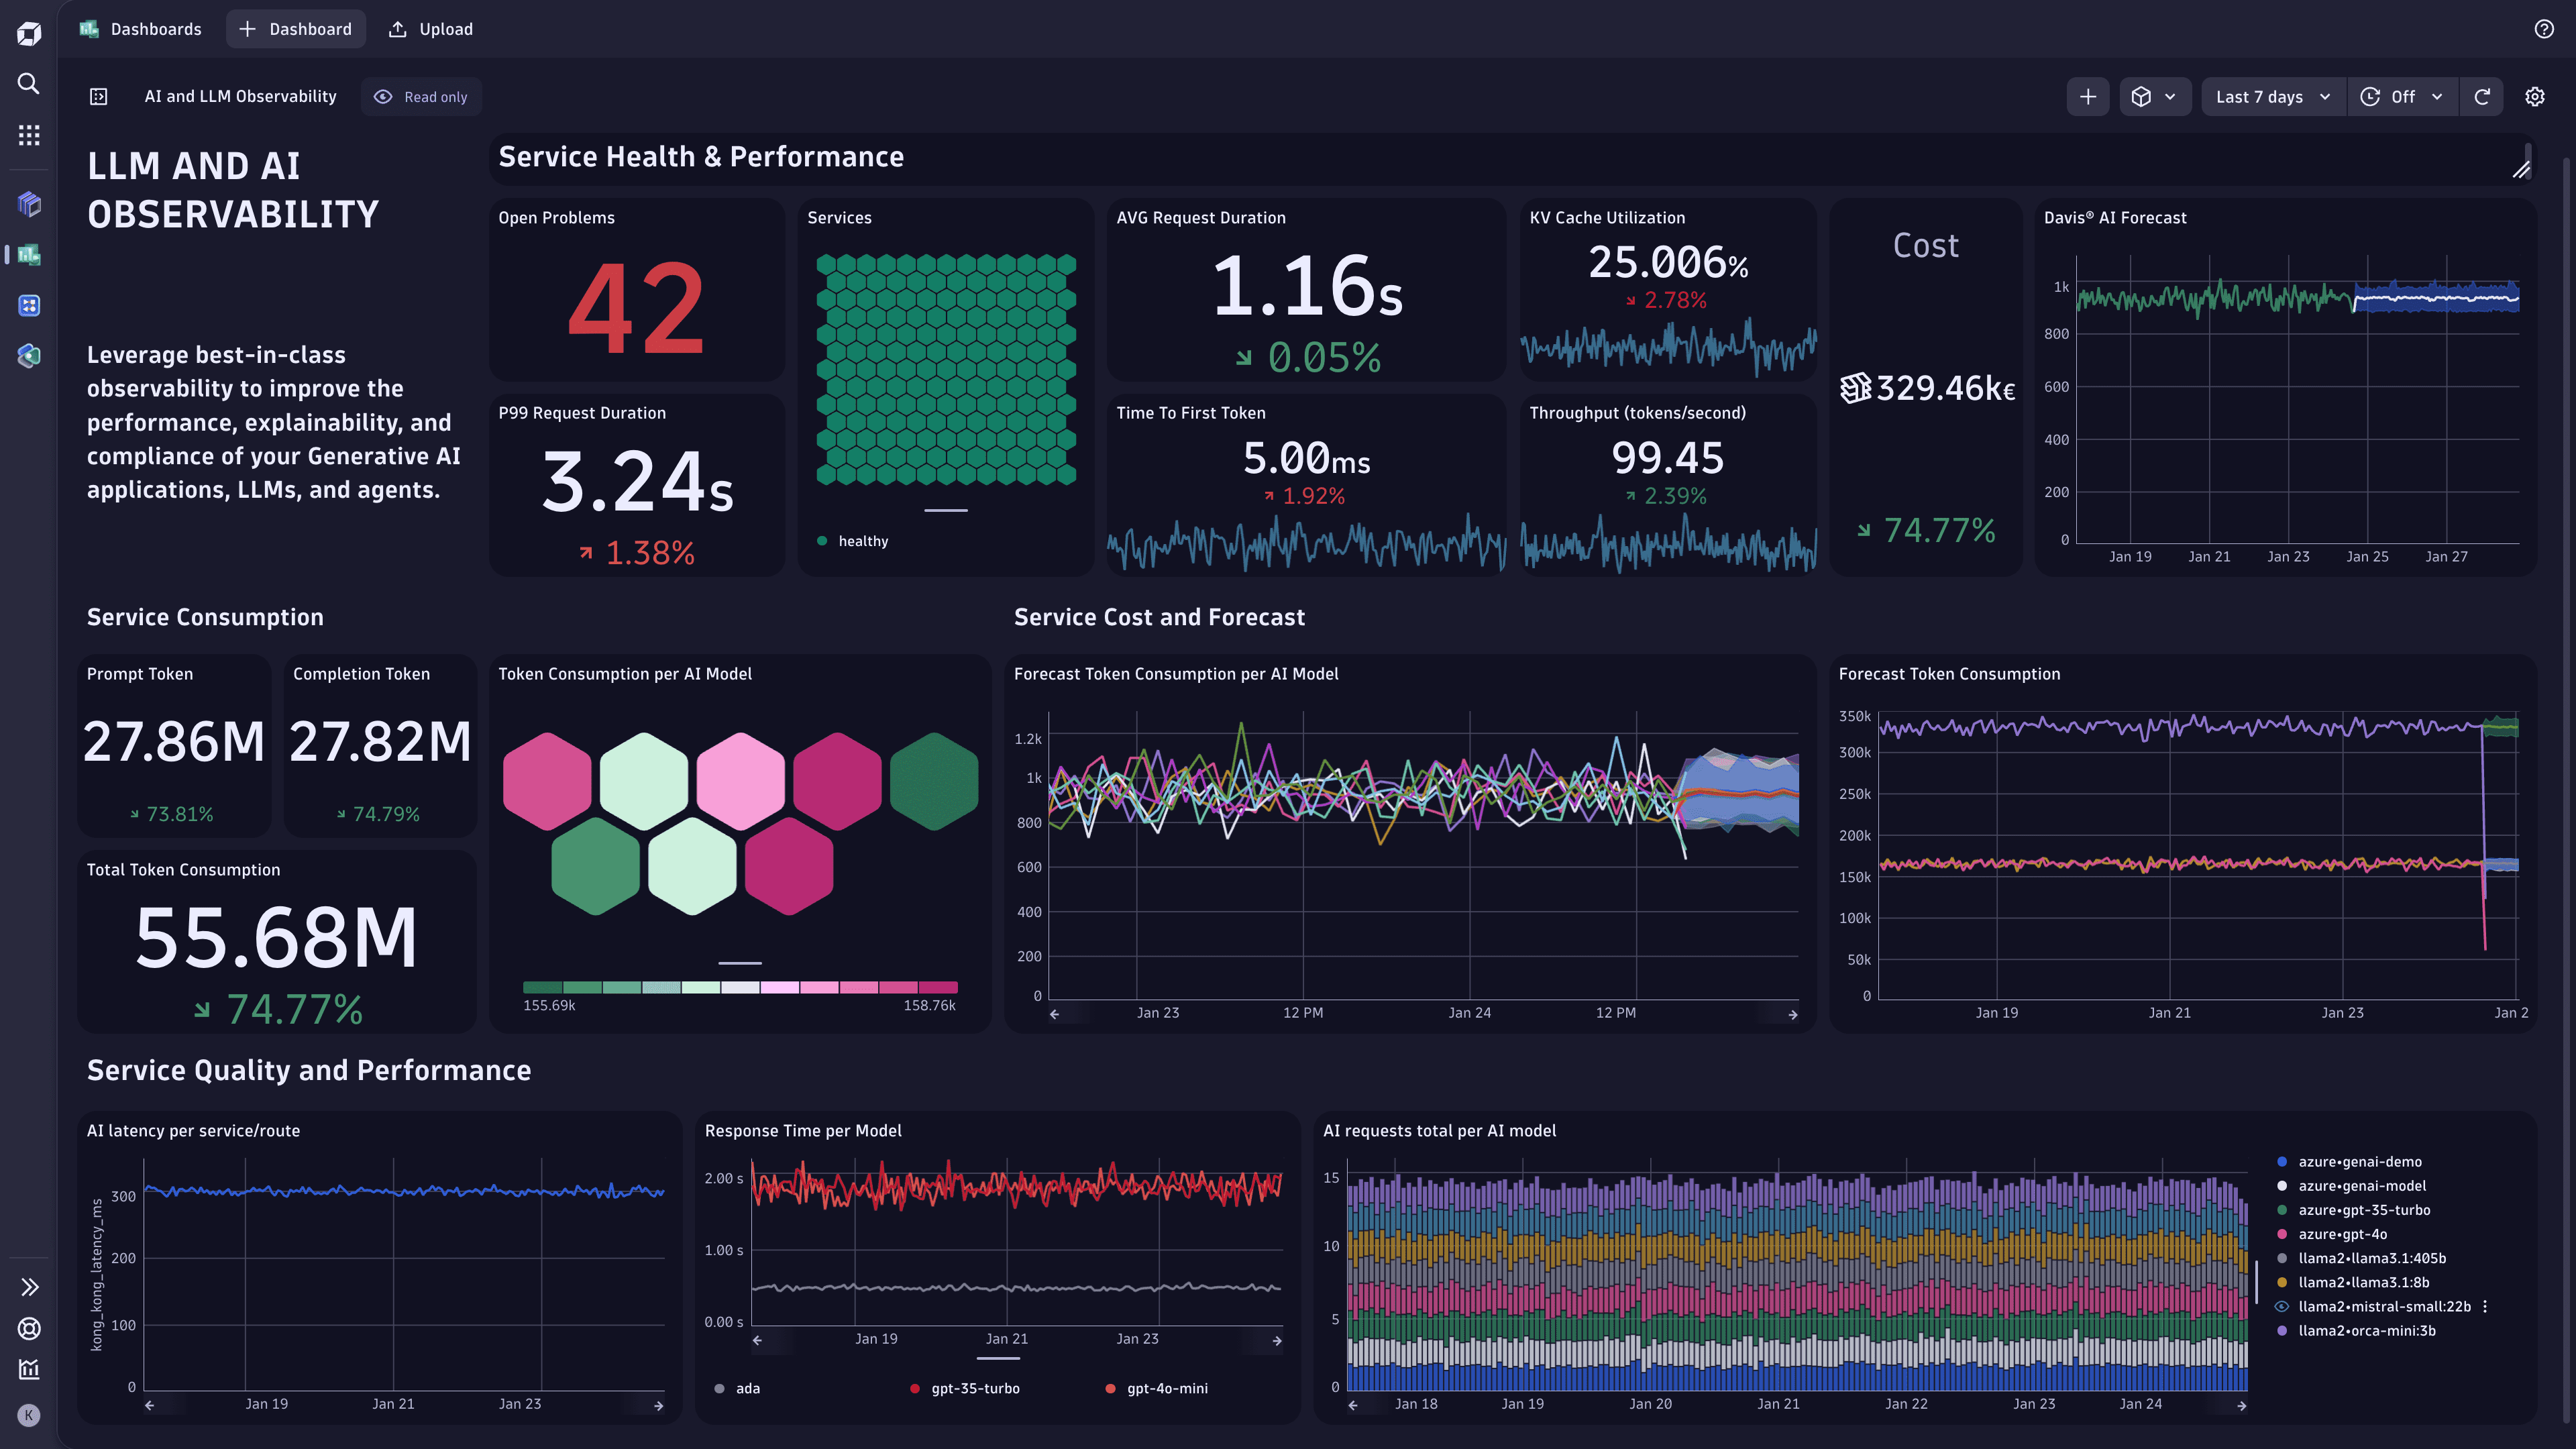
Once your AI application starts sending telemetry data, you can explore it in Dynatrace:- Navigate to Observability: Go to Observe and explore in your Dynatrace environment
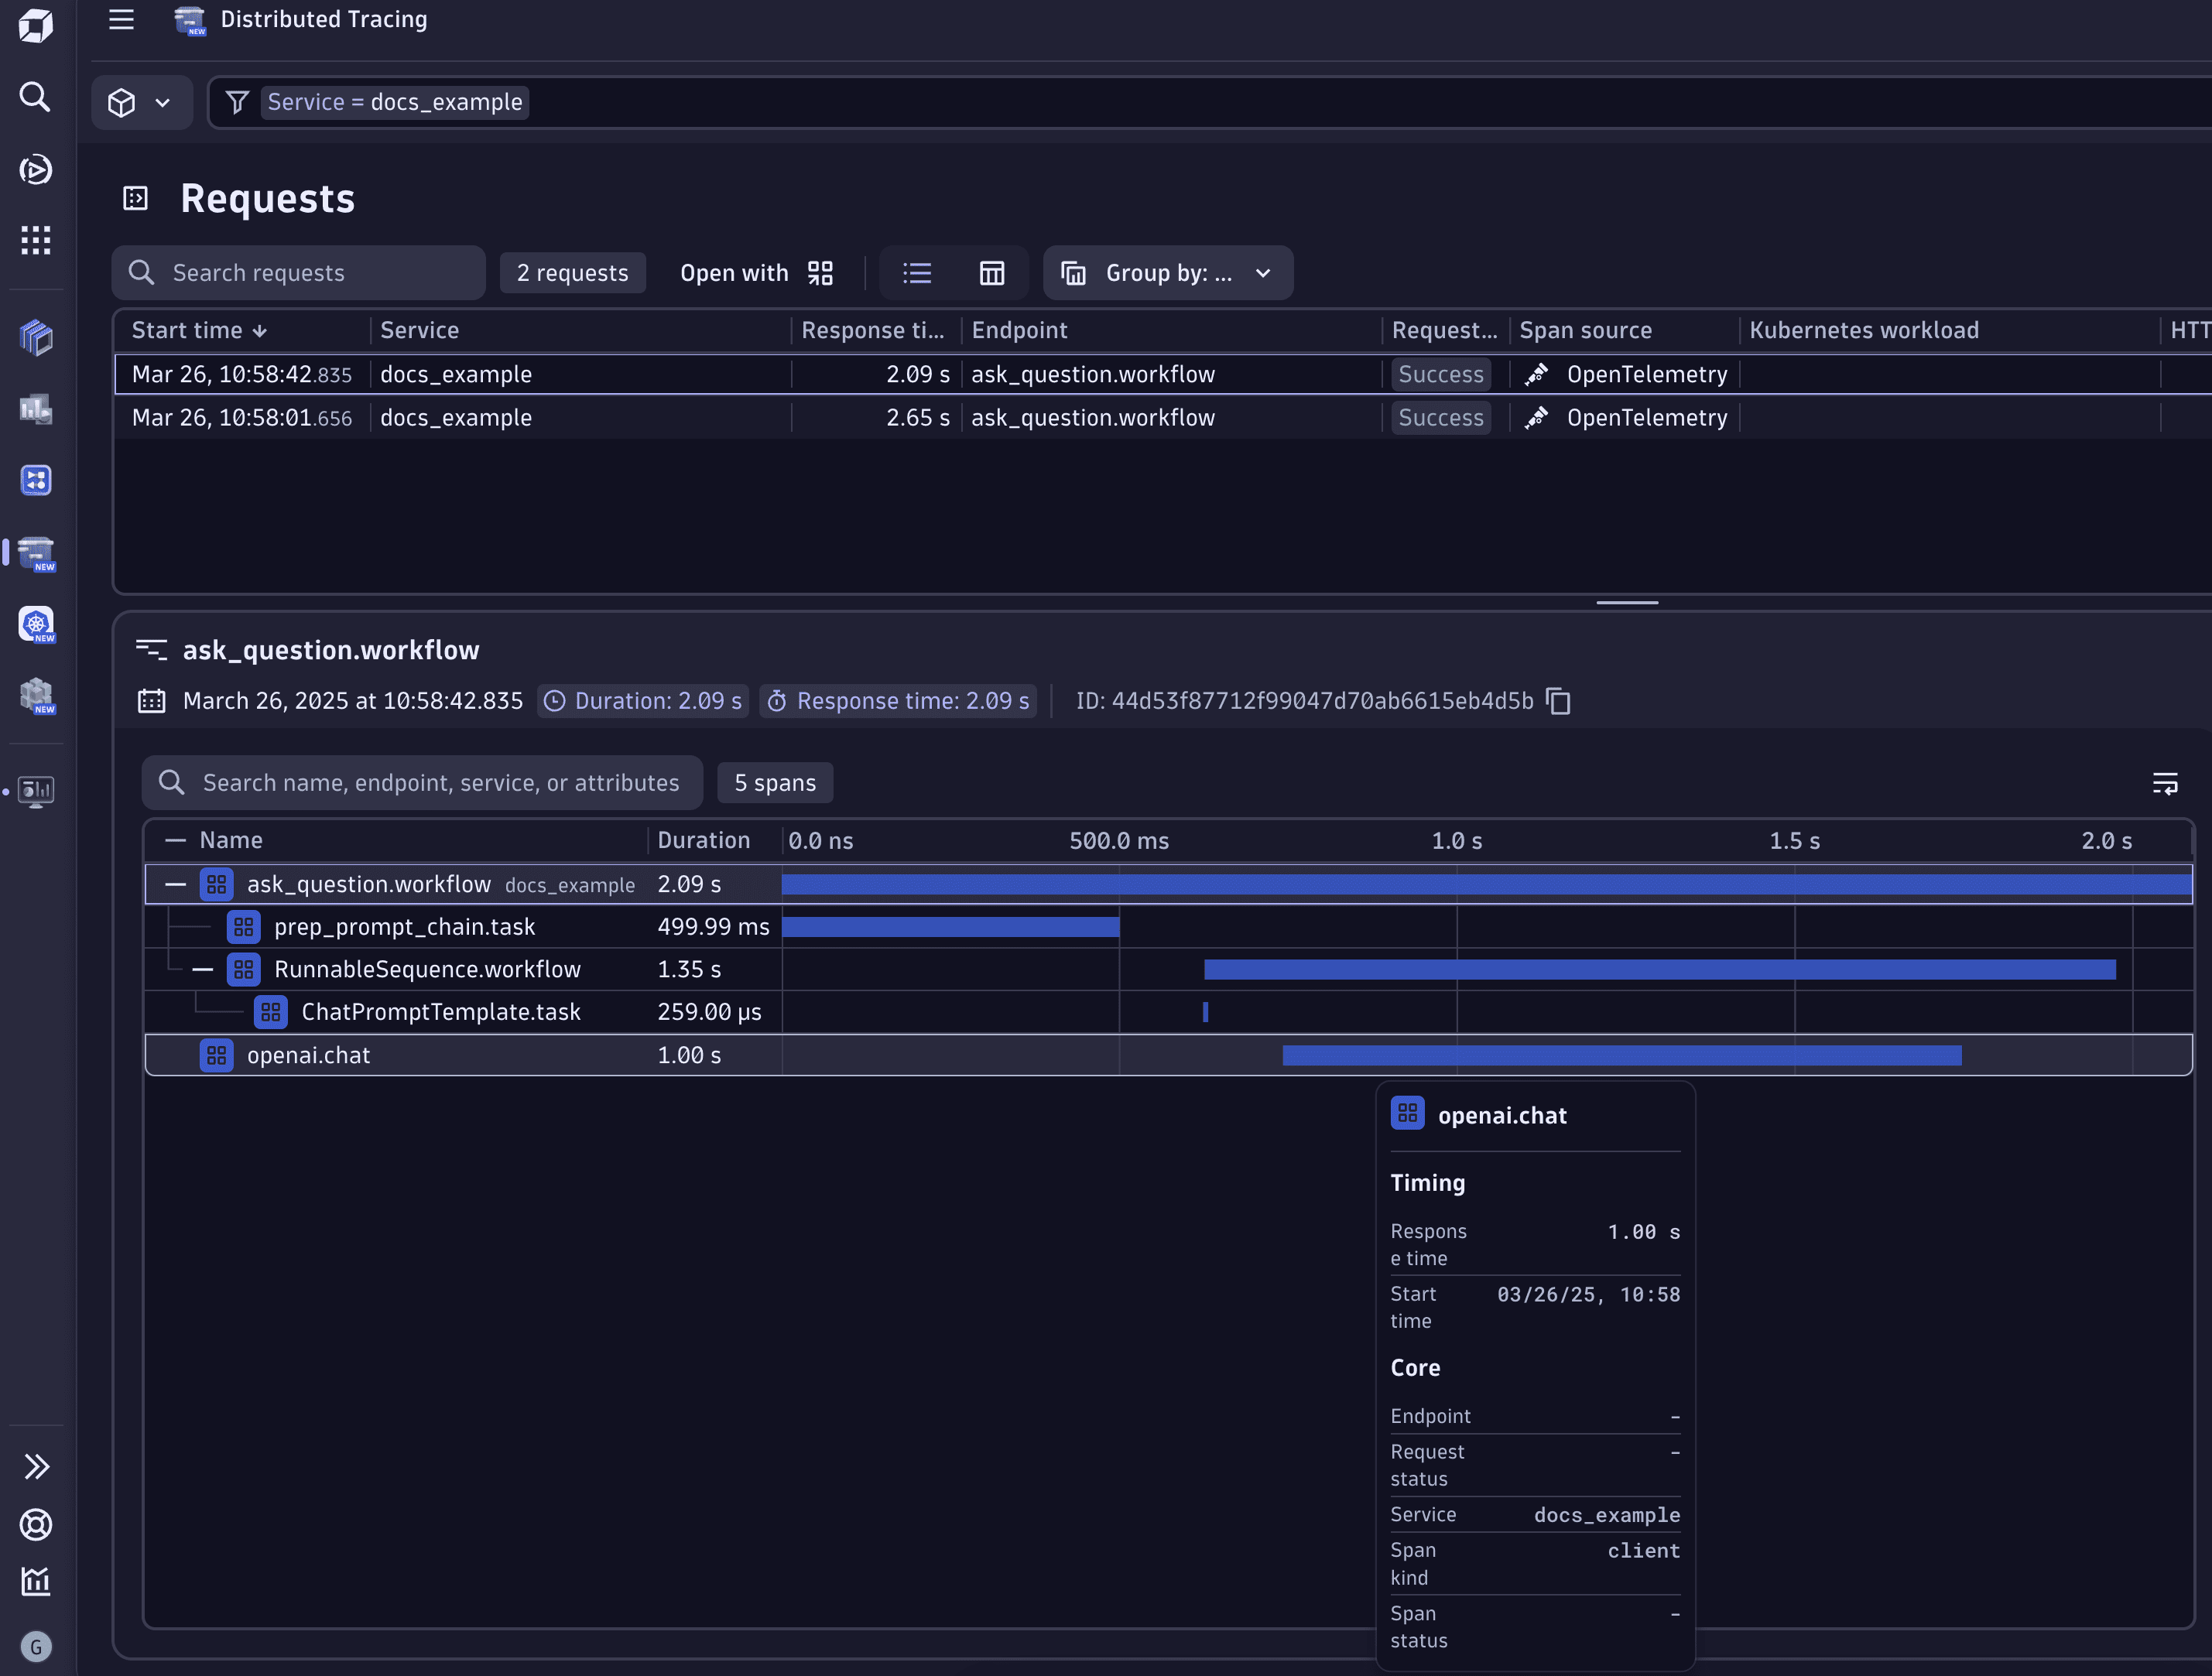
- Distributed traces: View Distributed traces to see your AI application traces with LLM calls and vector operations
- Services: Check Services to monitor your AI service performance and dependencies
- Metrics: Explore custom metrics in Metrics for token usage, costs, and AI-specific KPIs