
/telemetry) to view all distributed traces from your AI applications with detailed span analysis and execution flow. You can also create custom trace widgets in your dashboards to monitor specific trace metrics, latency trends, and performance insights alongside other observability data.
Filtering
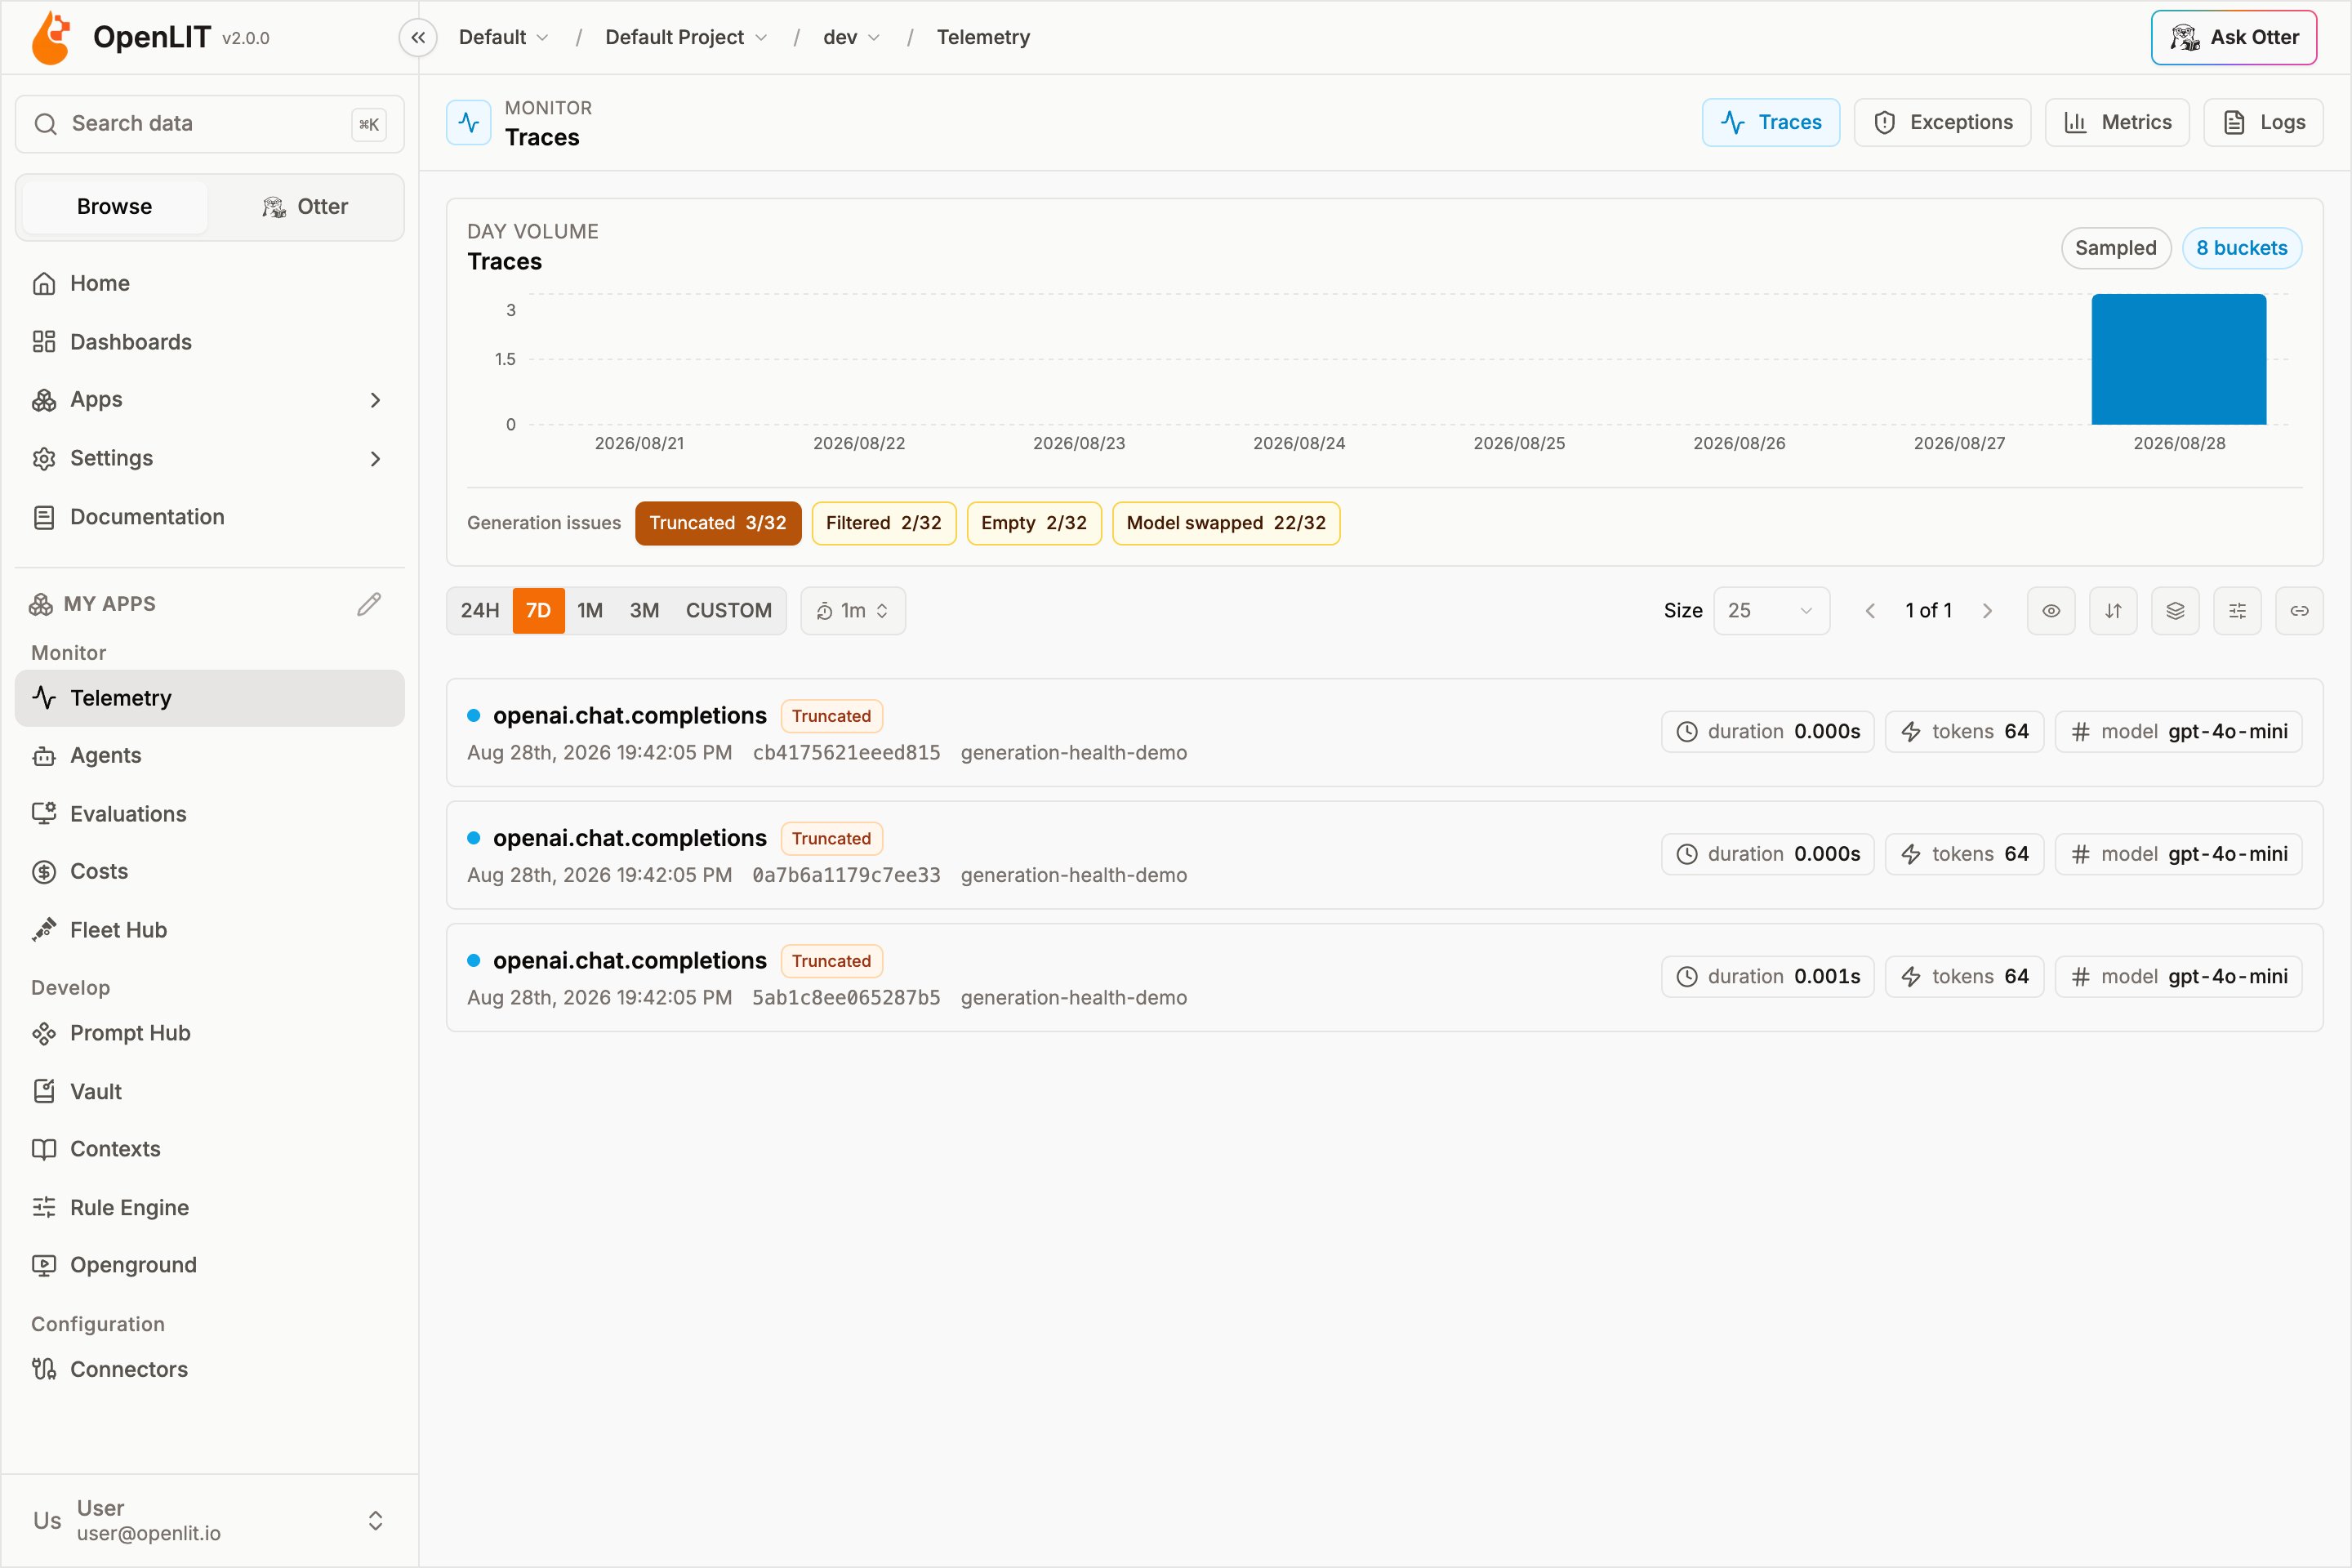
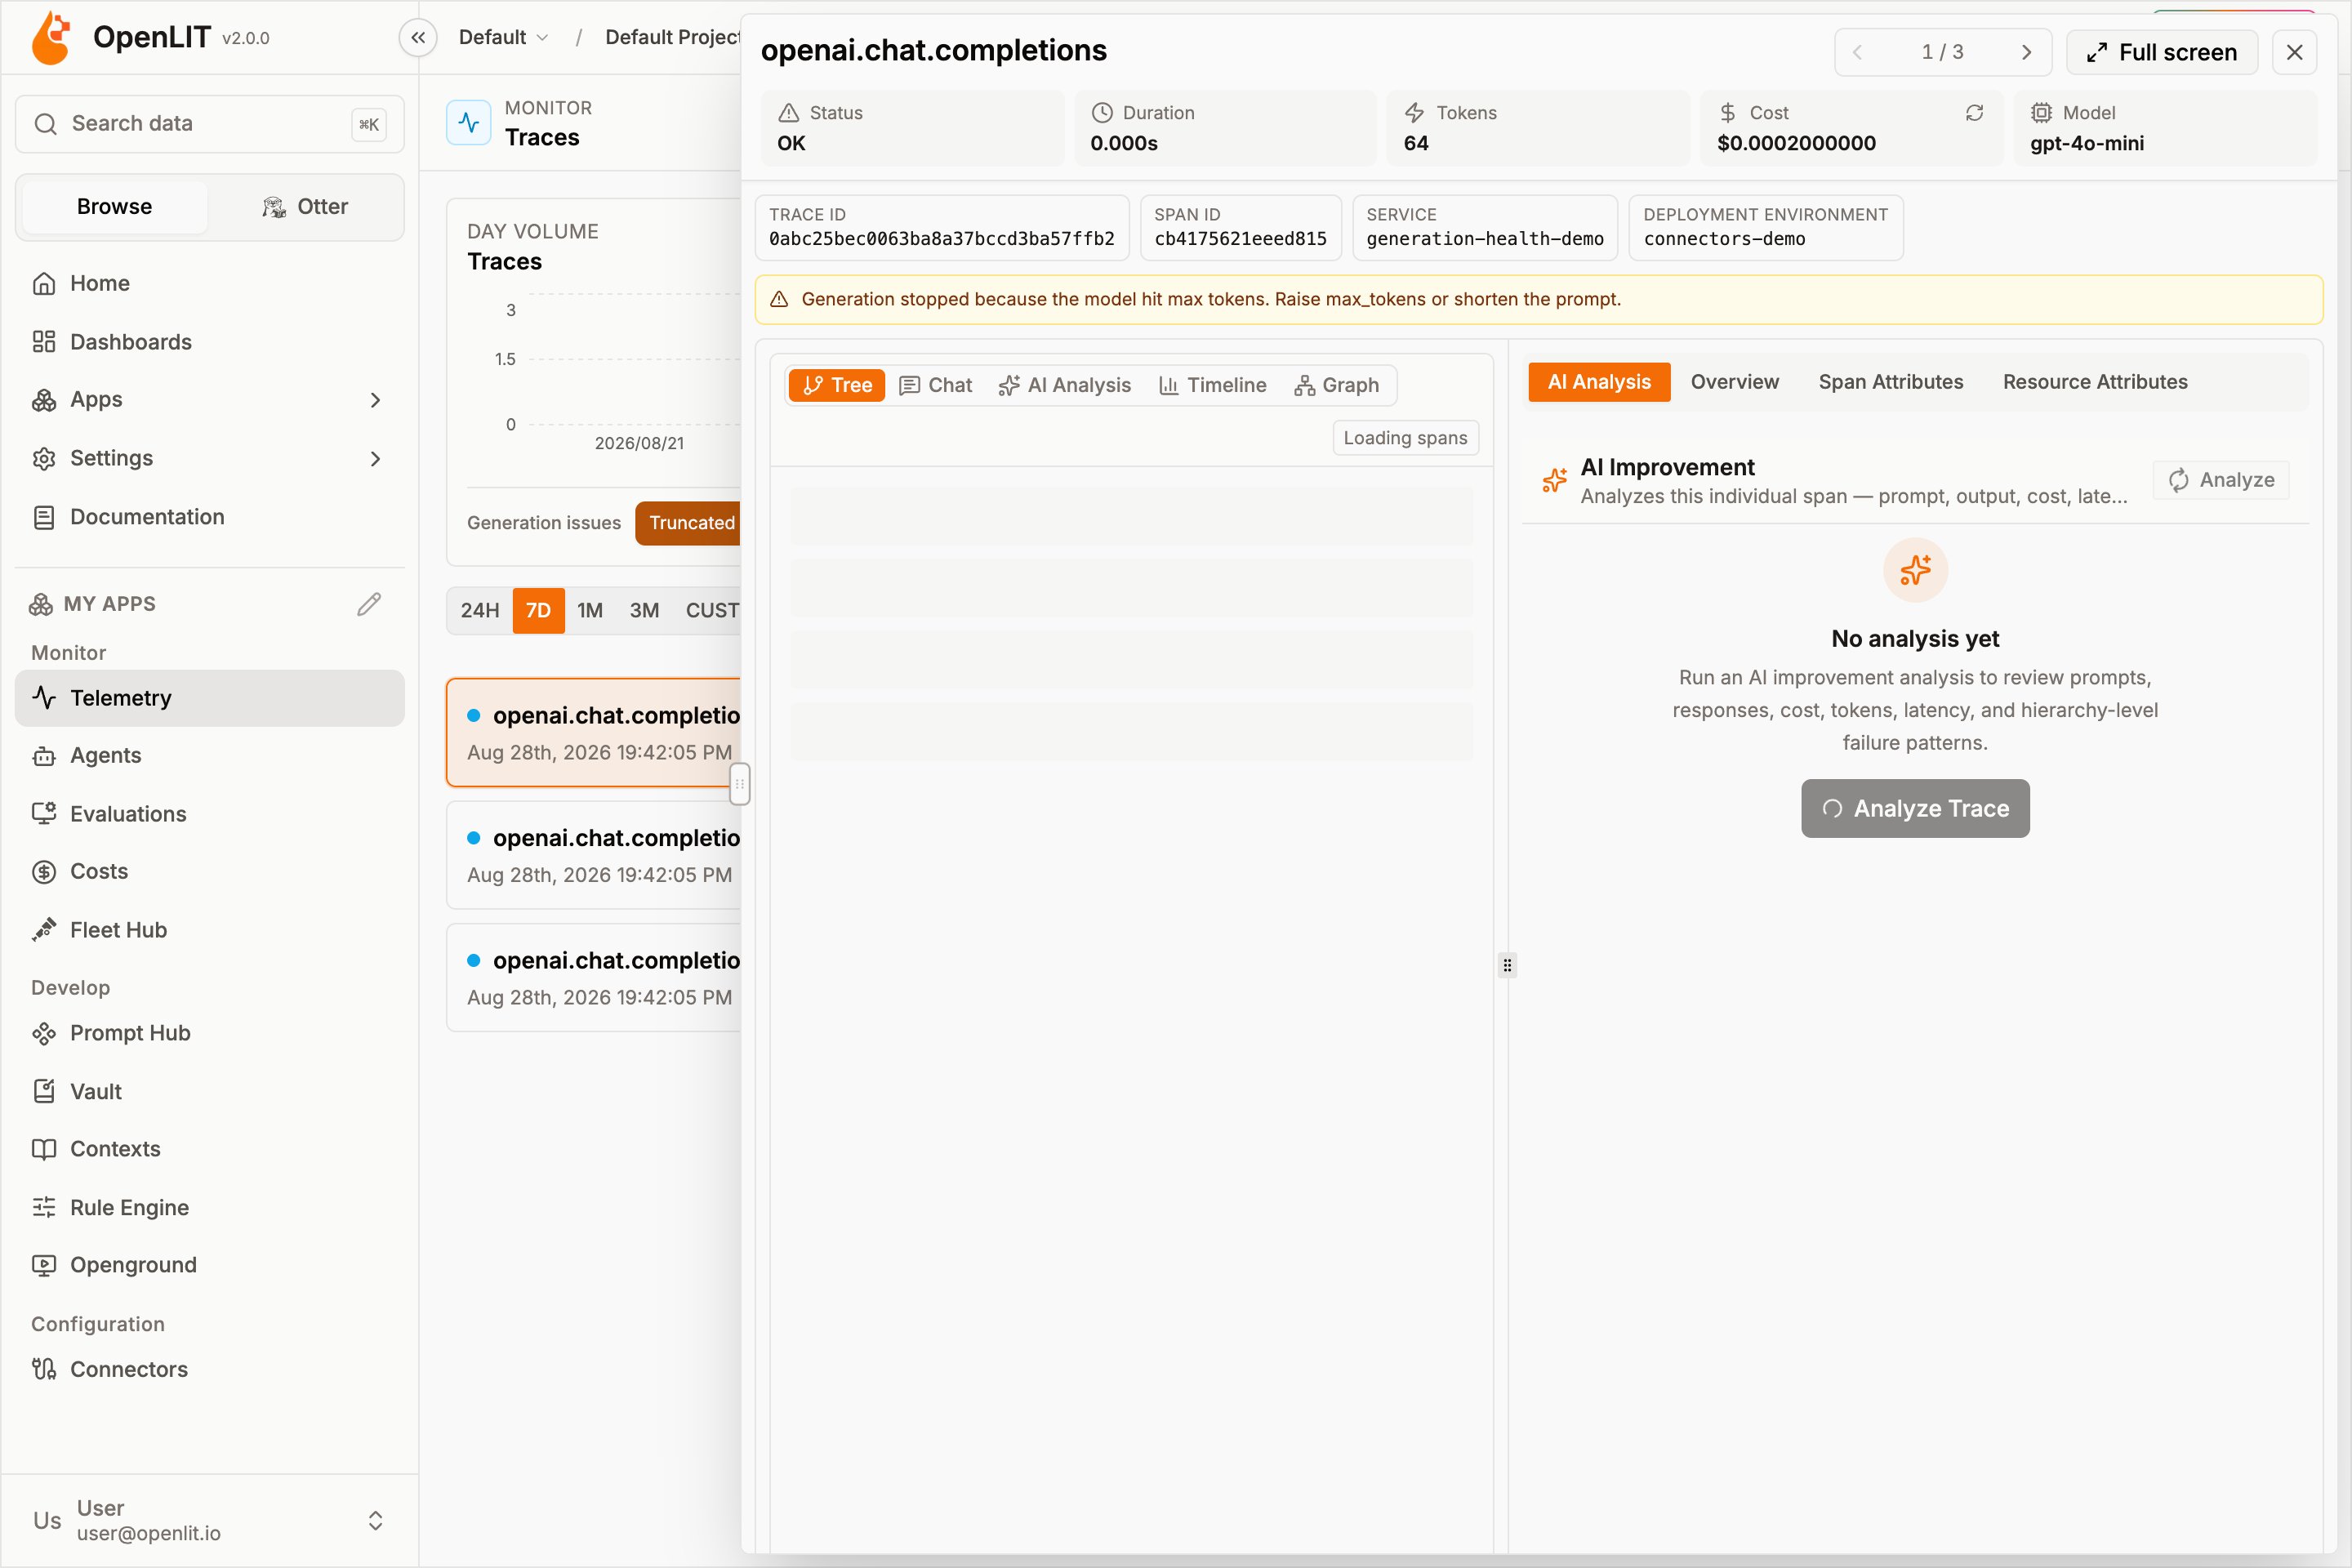
The Traces list supports filtering by Models, Providers, Max Cost, Span Names, Environments, Services, Generation issues, and Agent loops, plus a time range and result limit. You can also filter on custom attributes - Span Attributes, Resource Attributes, or any top-level trace Field. The trace table shows, per row: Span/Trace ID, Time, Span Name, Duration, Service Name, Application Name, Cost, Total Tokens, Model, Provider, and Vector Count. Rows with a generation issue also show a Truncated, Filtered, Empty, or Model swapped badge. Stuck-agent loops show a Loop badge. Clicking a row opens the trace detail view in a resizable side sheet, with a Full Screen button that opens the same view at/telemetry/traces/<id>.
Generation issues
The Generation issues bar sits under the traces volume chart. Each chip is{count}/{eligible} for the current time window — unique traces, not individual spans — so retries and nested generations do not inflate the totals.

Percentages use the eligible set: traces that recorded the attributes needed for that check (finish reason, output tokens, or both model names). Hover a chip for the meaning, the count in this window, and whether clicking will filter or clear.

max_tokens or shortening the prompt.
Generation issues work on every traces connector OpenLIT can list — built-in ClickHouse plus Tempo, Jaeger, and other OpenPlait adapters. ClickHouse counts the full window. External backends sample traces in the window, so chip totals there describe the sample rather than every trace in storage.
Agent loops
The Agent loops bar sits under Generation issues. A Loop chip is{count}/{eligible} for the current time window — unique traces that called a tool at least once. The numerator is traces that belong to a conversation or session where the same tool was called with the same arguments at least three times.
That is the agent equivalent of a crash loop: search, get_order, or read_file repeating until the budget dies. The waterfall looks busy; the badge names the stuck tool.
Hover the chip for the meaning and whether clicking will filter or clear. Click it to list only looping traces. Matching rows show a Loop badge (search × 7). Open the trace to see wasted tokens and cost on the detail header.
Loop detection uses attributes you already emit:
- Group key, in order:
gen_ai.conversation.id, thencoding_agent.session.id, thenTraceId - Tool identity:
gen_ai.tool.name(orgen_ai.tool.call.name) - Arguments:
gen_ai.tool.args/gen_ai.tool.call.arguments, compared after collapsing whitespace (no embeddings)
Agent loops work on every traces connector OpenLIT can list — built-in ClickHouse plus Tempo, Jaeger, and other OpenPlait adapters. ClickHouse counts the full window. External backends sample traces in the window, so the Loop chip there describes the sample rather than every trace in storage.
Group traces
Use Group By on the Traces page to roll up large trace lists into meaningful groups before drilling into individual spans. Grouping works with the selected time range and any active filters, so you can narrow the dataset first and then compare trace segments. You can group traces by:- Model: Compare requests by
gen_ai.request.model. - Provider: Compare requests by
gen_ai.system. - Span Names: Group repeated operations or framework steps.
- Application: Compare services using the
service.nameresource attribute.
Grouping is best for finding high-volume models, expensive providers, slow span types, or application-level hotspots before opening an individual trace.
Trace detail view
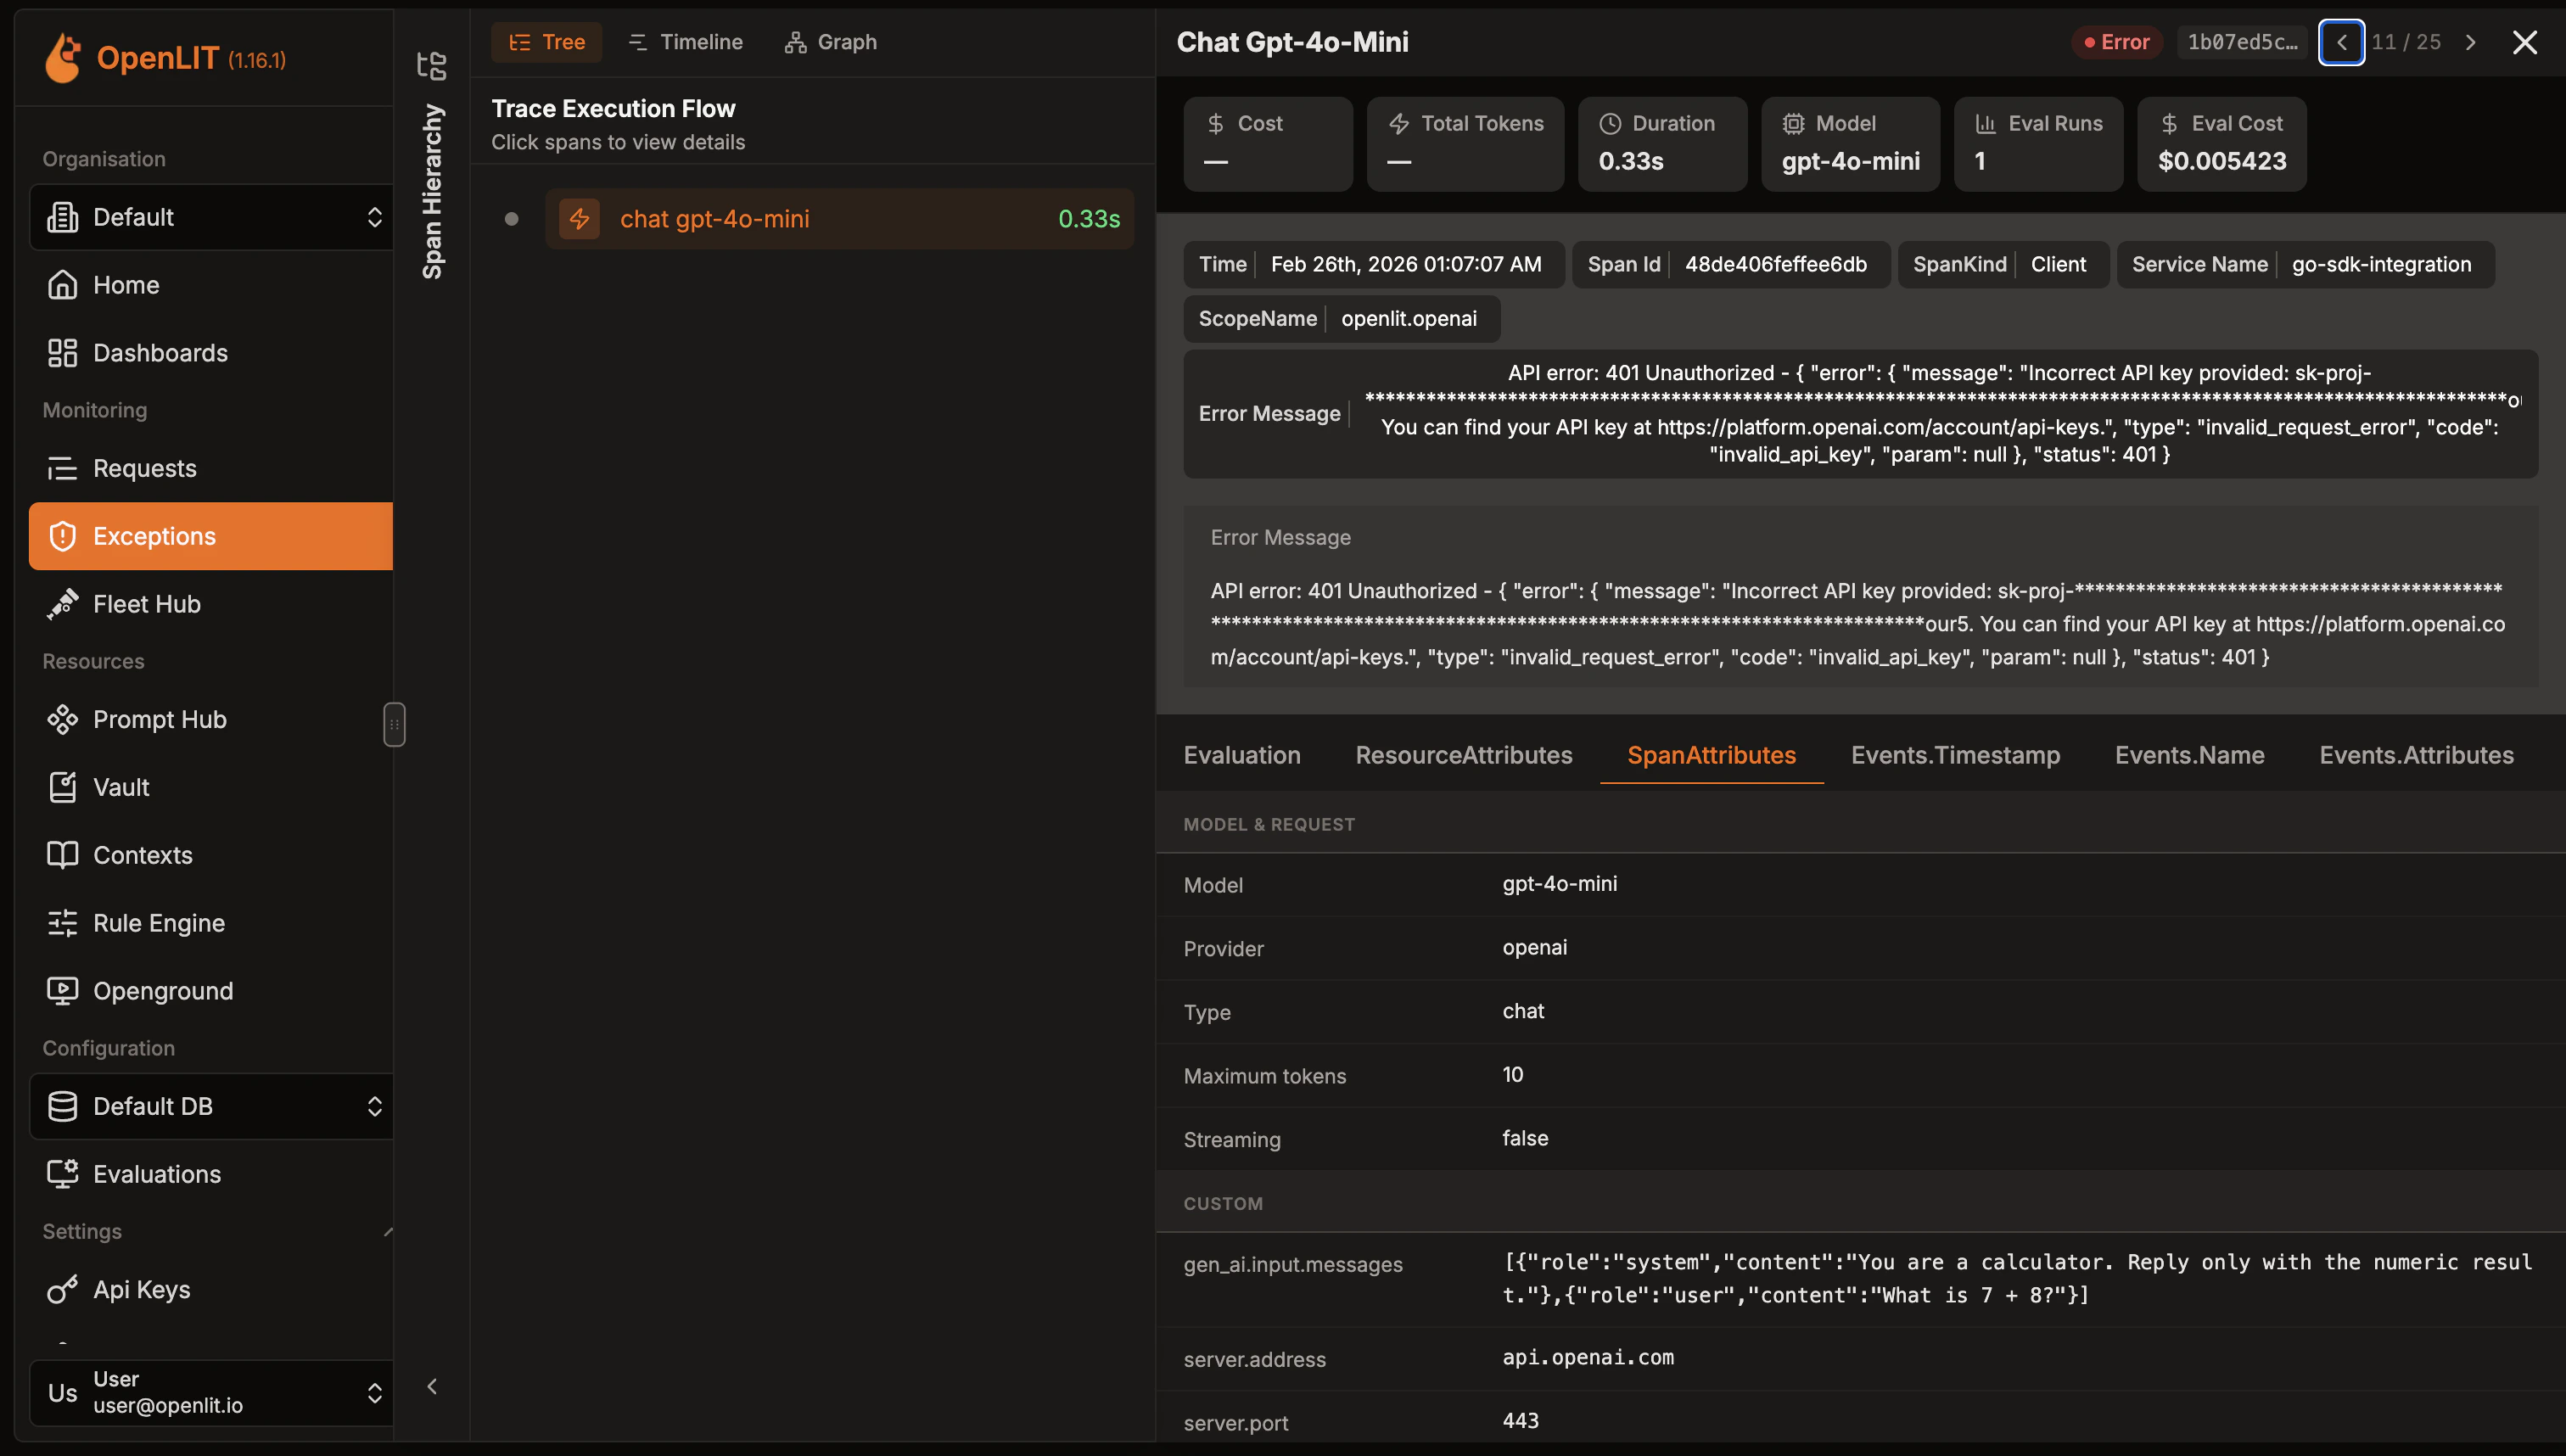
Opening a trace splits the screen into two panels.Left panel: five view modes
The left panel is the Span Hierarchy Explorer, with five tabs:- Tree: The classic nested span hierarchy, one row per span with its children indented underneath.
- Chat: A conversational rendering of the trace - messages, tool calls, and thinking steps laid out like a chat transcript instead of a span tree. Traces from coding agents (Claude Code, Cursor, Codex, Windsurf) open on this view by default, since a conversational read is more useful than a span tree for those traces.
- AI Analysis: Runs the AI Analysis panel scoped to the whole trace hierarchy.
- Timeline: A waterfall view of every span plotted against elapsed time, useful for spotting sequential bottlenecks and overlapping work.
- Graph: A DAG (directed acyclic graph) view of the trace’s call flow - nodes for spans, edges for parent/child call relationships.
Right panel: attributes, per-span analysis, and evaluations
The right panel shows raw data for the span currently selected in the left panel:- Span Attributes: every OTel attribute recorded on the selected span.
- Resource Attributes: service- and environment-level resource attributes.
- AI Analysis: a second, span-scoped AI Analysis tab - lets you analyze just the currently selected span instead of the whole trace.
- Evaluations: shown only when evaluation scores exist for the trace, with per-check results.
Exceptions
The Exceptions tab shows all traces that contain errors or exceptions from your AI applications. It uses the same trace list shell as Traces, but the table columns are Time, Span Name, Duration, Service Name, Deployment Type, and Exception Type, and you can filter by exception type in addition to time range.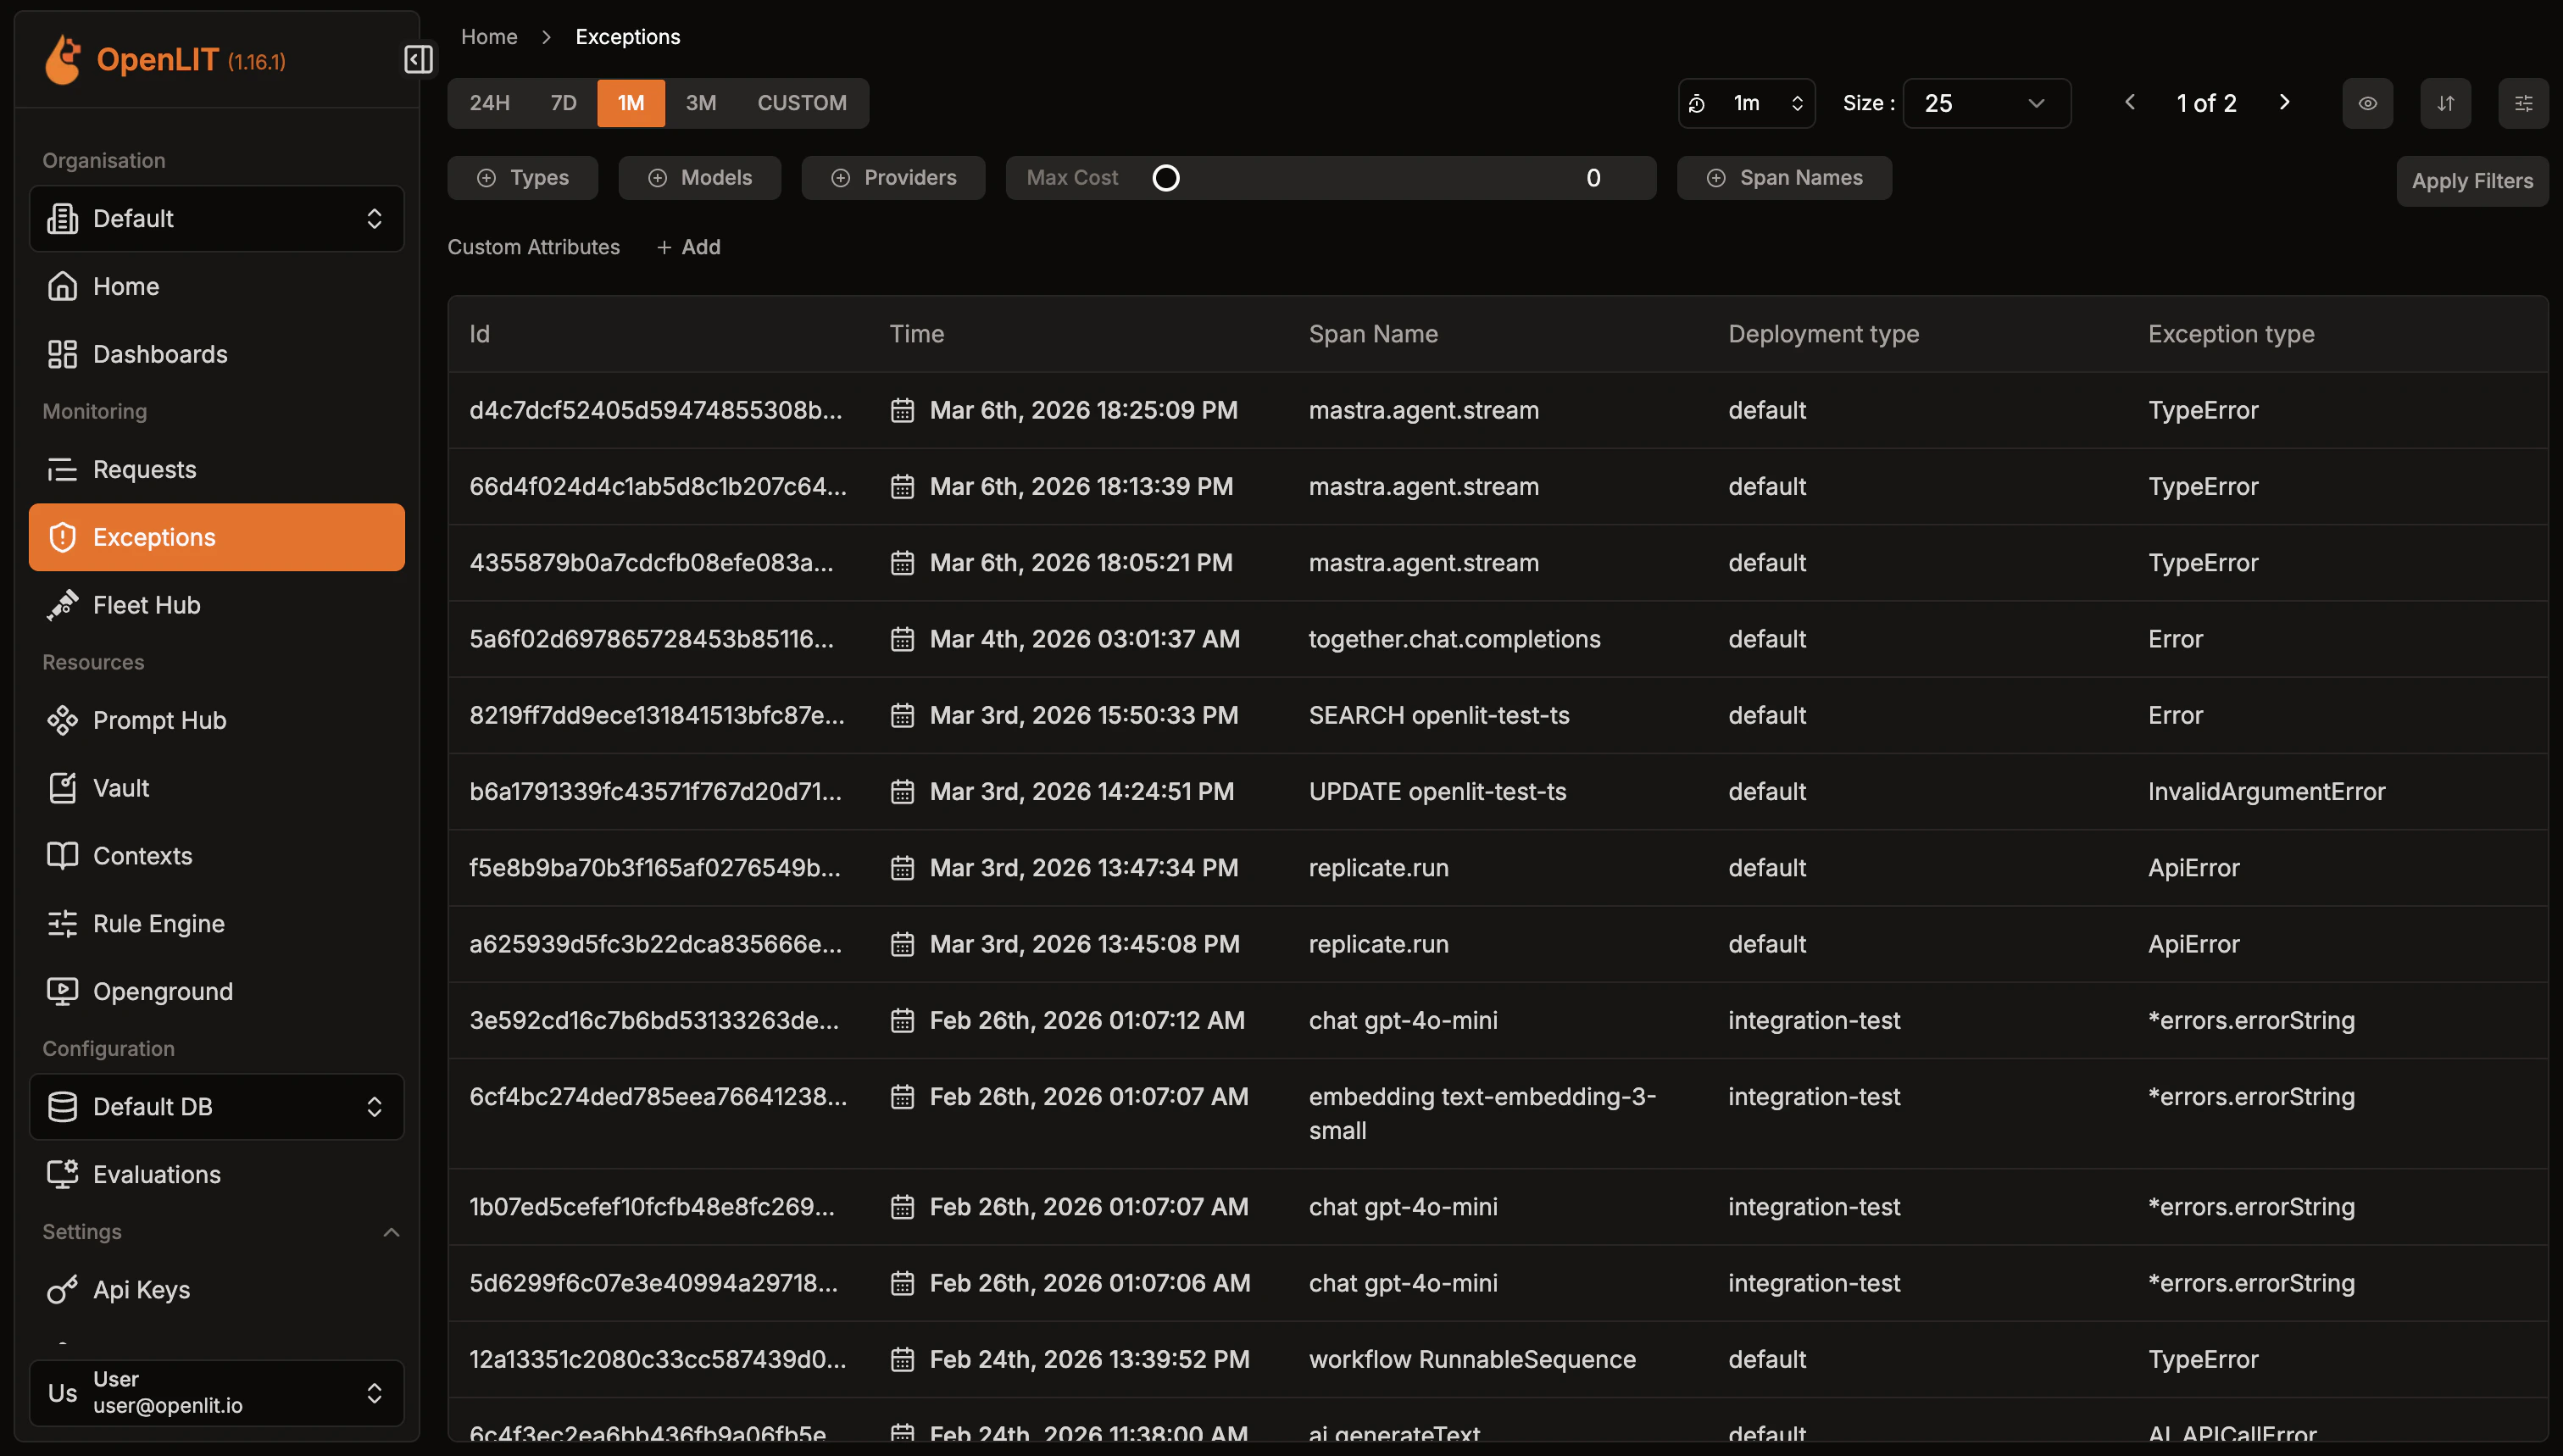
- LLM API errors: Authentication, rate limits, model issues
- Framework errors: LangChain, LlamaIndex execution failures
- Vector database errors: Connection and query issues
- Application errors: Custom exceptions and validation errors
AI Analysis
Turn a trace or span into a structured review of performance, cost, and reliability
Metrics
Explore the metrics captured alongside your traces