> ## Documentation Index
> Fetch the complete documentation index at: https://docs.openlit.io/llms.txt
> Use this file to discover all available pages before exploring further.
# OneUptime
> LLM Observability with OneUptime and OpenLIT
 To send OpenTelemetry metrics and traces generated by OpenLIT from your AI Application to OneUptime, follow the below steps.
### 1. Get your Credentials
1. **Sign in to your OneUptime account**
2. **Navigate to Project Settings**:
* Click on **More** in the Navigation bar
* Click on **Project Settings**
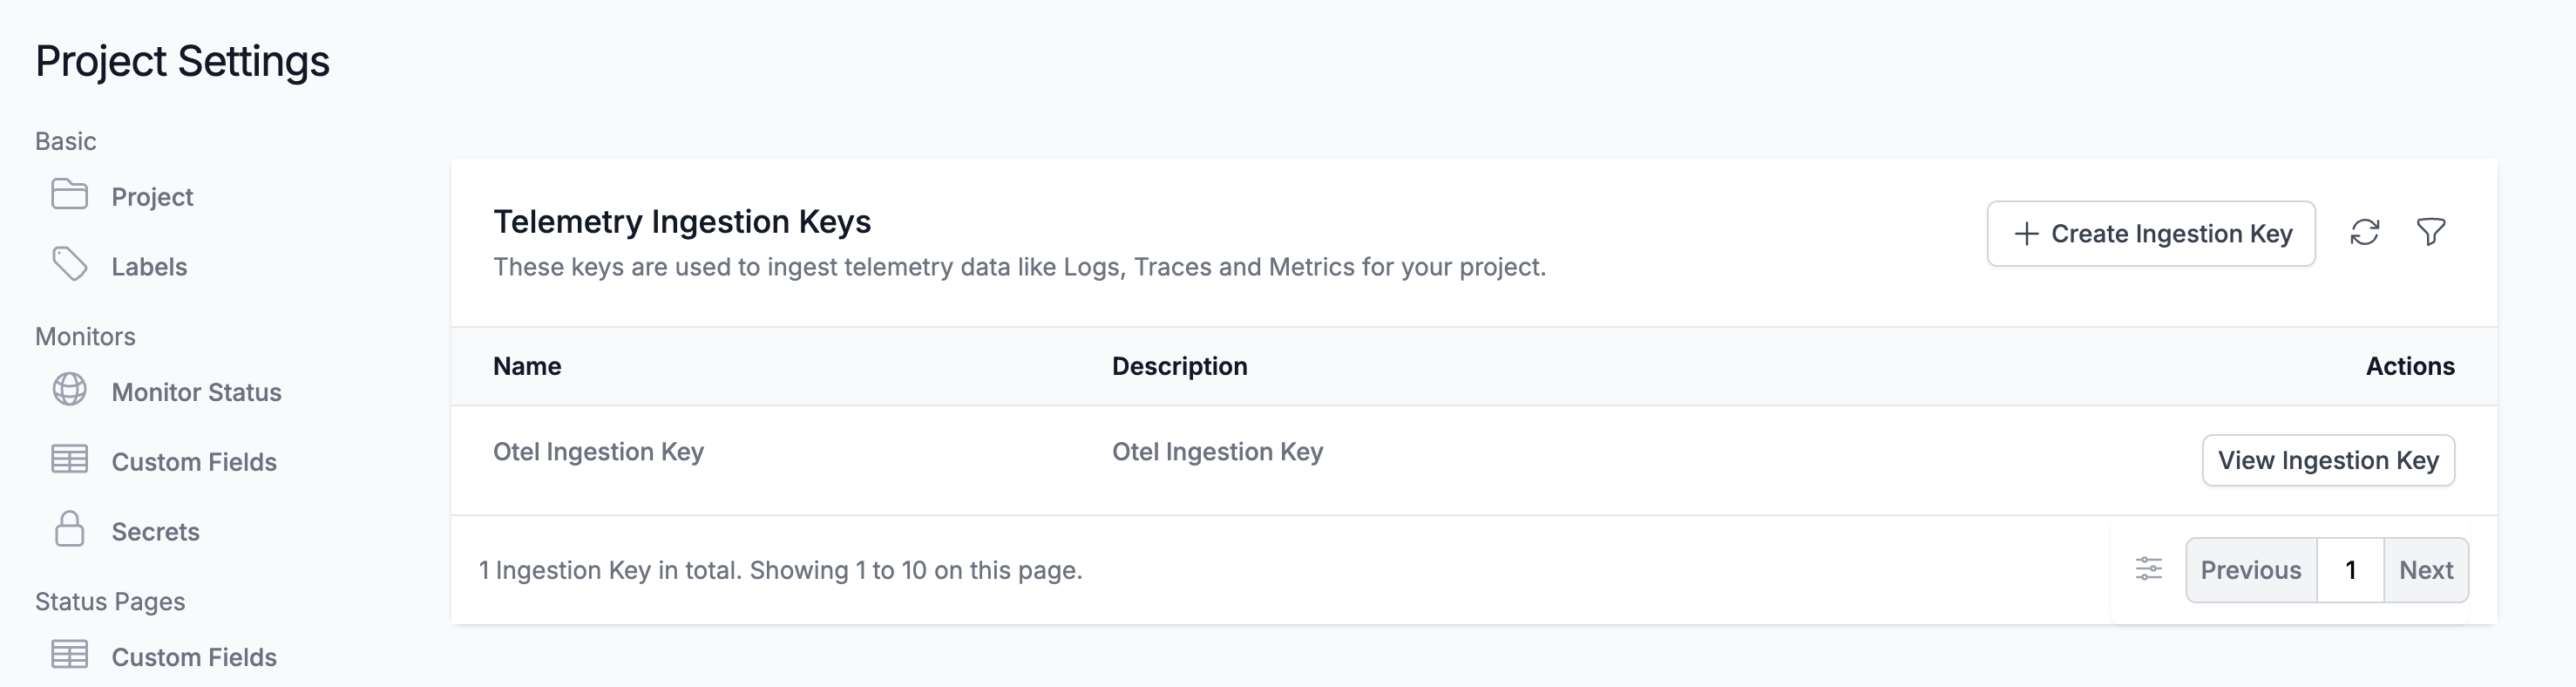
3. **Create Telemetry Ingestion Key**:
* On the Telemetry Ingestion Key page, click on **Create Ingestion Key** to create a token
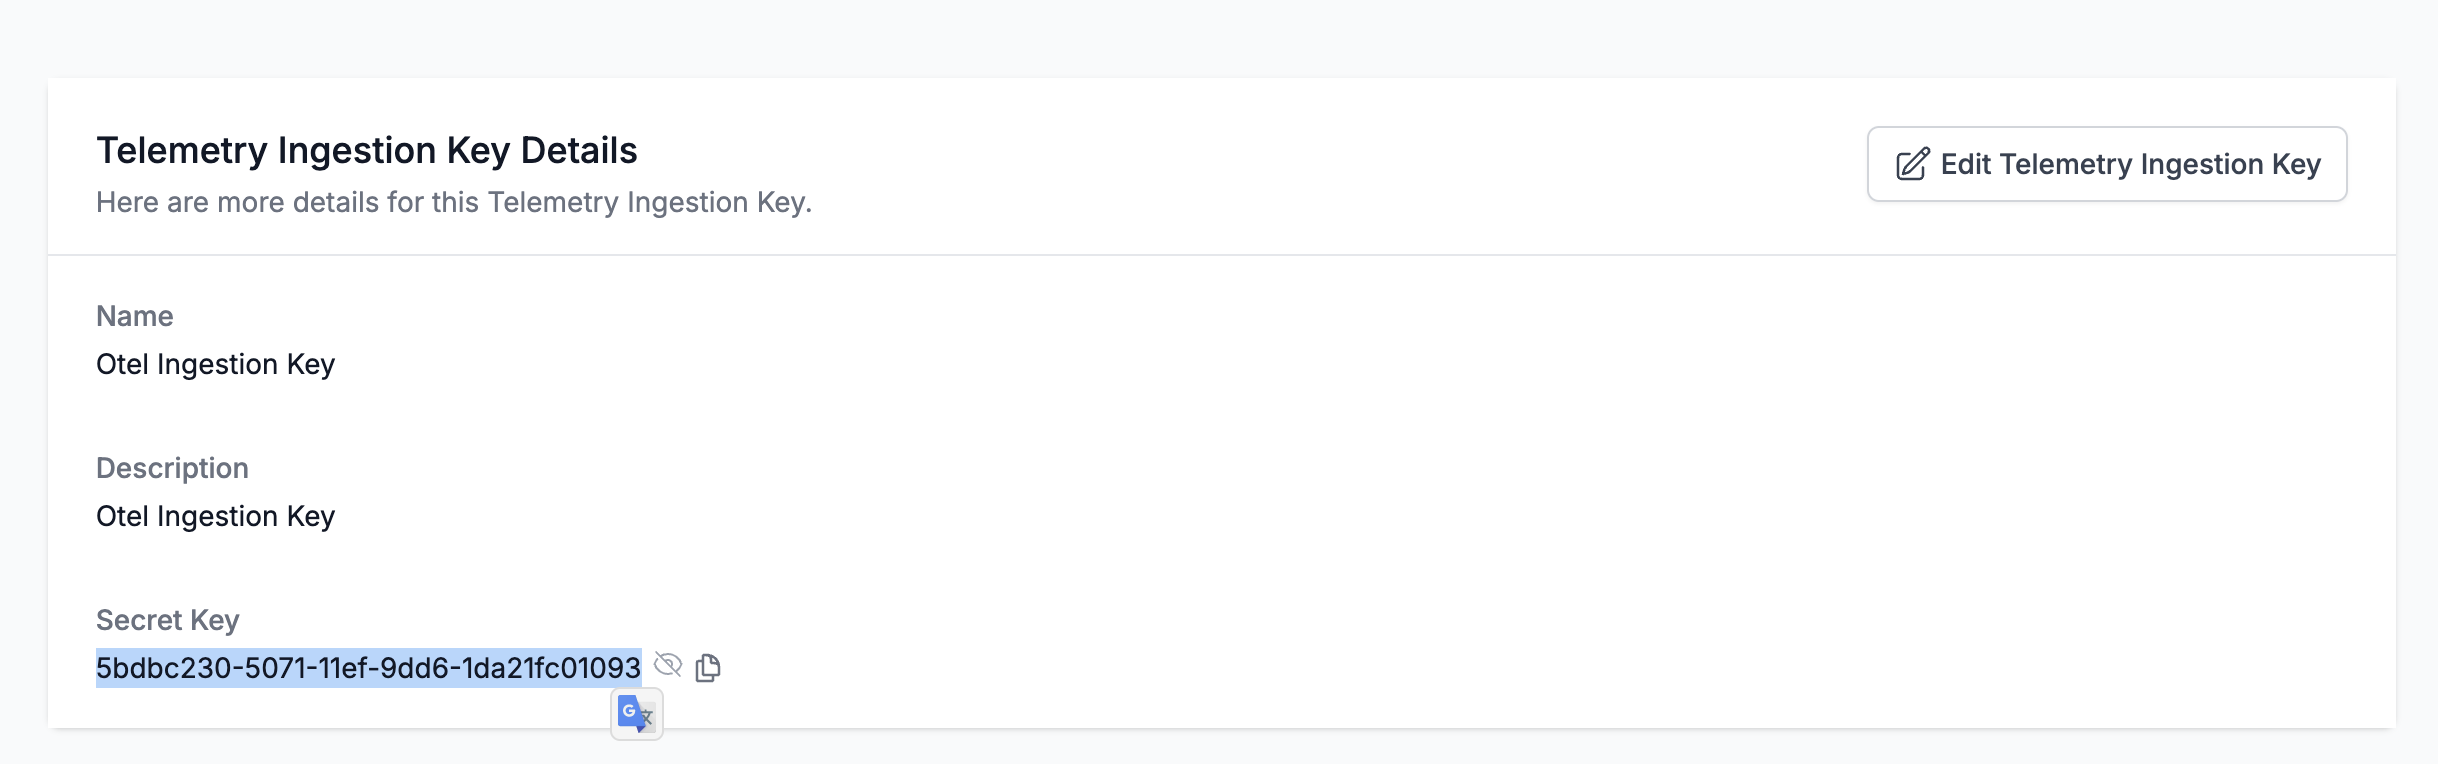
4. **Copy the Token**:
* Once you created a token, click on **View** to view and copy the token
### 2. Instrument your application
**For direct integration into your Python applications:**
```python theme={null}
import openlit
openlit.init(
otlp_endpoint="https://otlp.oneuptime.com",
otlp_headers="x-oneuptime-token=YOUR_ONEUPTIME_SERVICE_TOKEN"
)
```
Replace:
1. `YOUR_ONEUPTIME_SERVICE_TOKEN` with the OneUptime Ingestion Key value you copied in Step 1.
```python theme={null}
import openlit
openlit.init()
```
Set these environment variables:
```shell theme={null}
export OTEL_EXPORTER_OTLP_ENDPOINT="https://otlp.oneuptime.com"
export OTEL_EXPORTER_OTLP_HEADERS="x-oneuptime-token=YOUR_ONEUPTIME_SERVICE_TOKEN"
```
Replace:
1. `YOUR_ONEUPTIME_SERVICE_TOKEN` with the OneUptime Ingestion Key value you copied in Step 1.
Refer to the OpenLIT [Python SDK repository](https://github.com/openlit/openlit/tree/main/sdk/python) for more advanced configurations and use cases.
**For zero-code auto-instrumentation via command line:**
```shell theme={null}
# Using CLI arguments
openlit-instrument \
--otlp-endpoint "https://otlp.oneuptime.com" \
--otlp-headers "x-oneuptime-token=YOUR_ONEUPTIME_SERVICE_TOKEN" \
--service-name "my-ai-service" \
--deployment-environment "production" \
python app.py
```
Replace:
1. `YOUR_ONEUPTIME_SERVICE_TOKEN` with the OneUptime Ingestion Key value you copied in Step 1.
```shell theme={null}
# Set environment variables (takes precedence over CLI args)
export OTEL_EXPORTER_OTLP_ENDPOINT="https://otlp.oneuptime.com"
export OTEL_EXPORTER_OTLP_HEADERS="x-oneuptime-token=YOUR_ONEUPTIME_SERVICE_TOKEN"
export OTEL_SERVICE_NAME="my-ai-service"
export OTEL_DEPLOYMENT_ENVIRONMENT="production"
# Run your application
openlit-instrument python app.py
```
Replace:
1. `YOUR_ONEUPTIME_SERVICE_TOKEN` with the OneUptime Ingestion Key value you copied in Step 1.
Refer to the OpenLIT [Python SDK repository](https://github.com/openlit/openlit/tree/main/sdk/python) for more advanced configurations and use cases.
### 3. Visualize in OneUptime
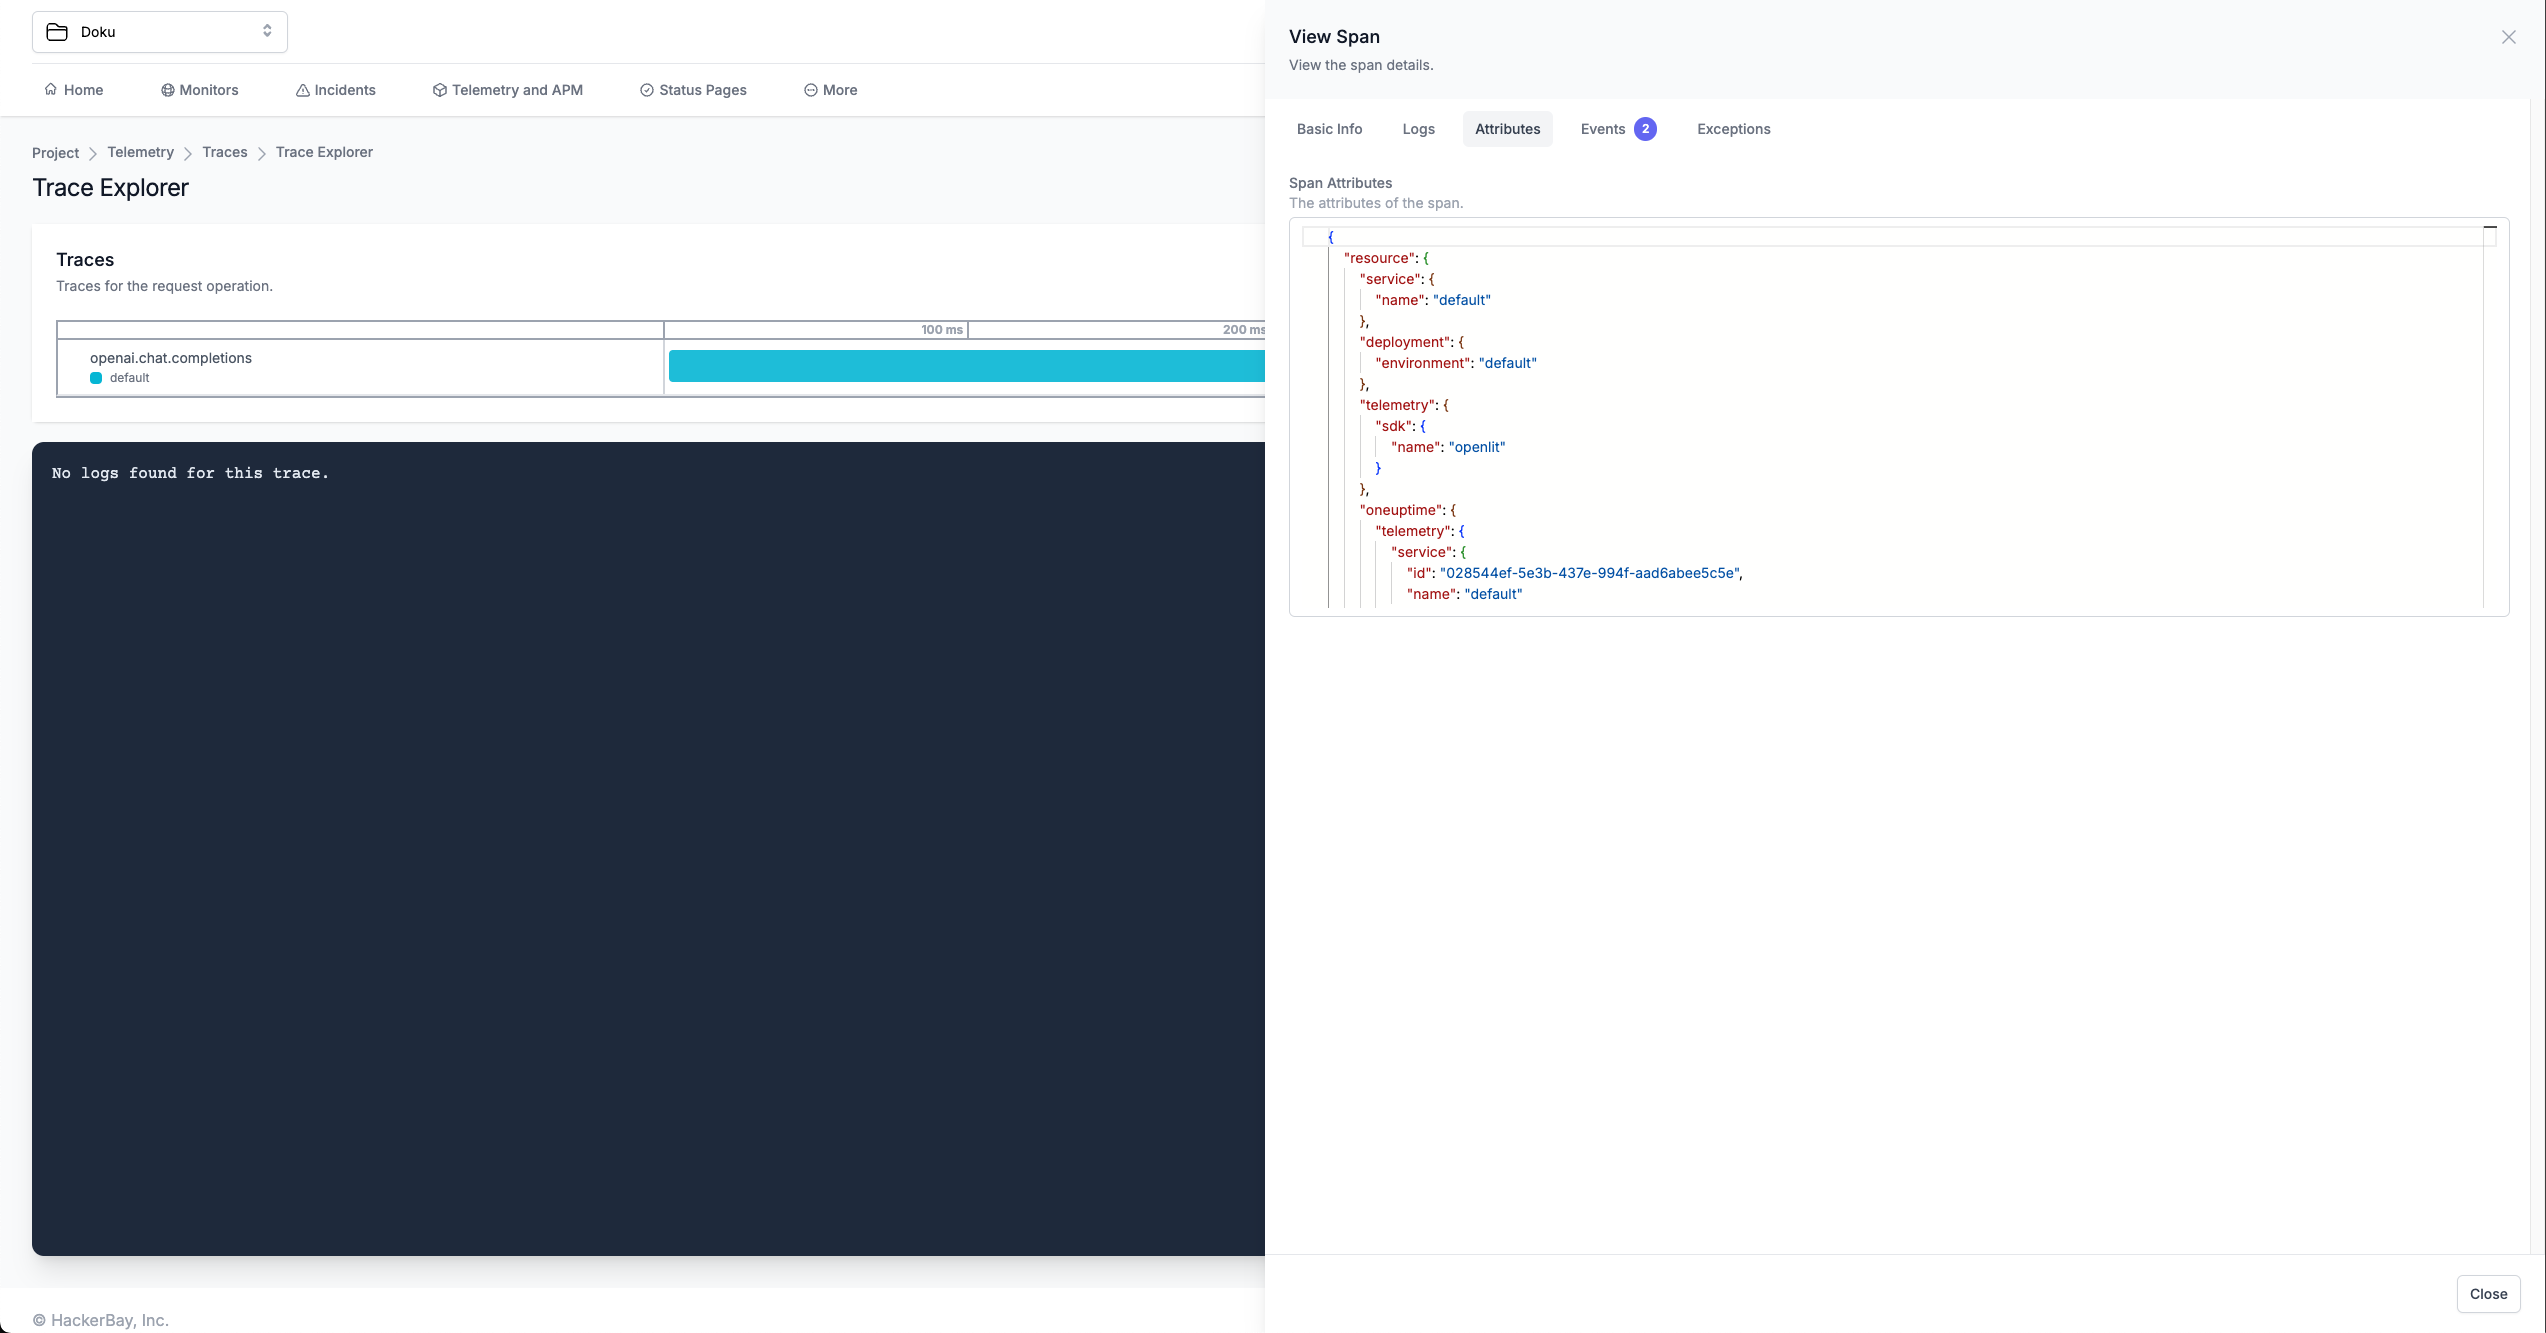
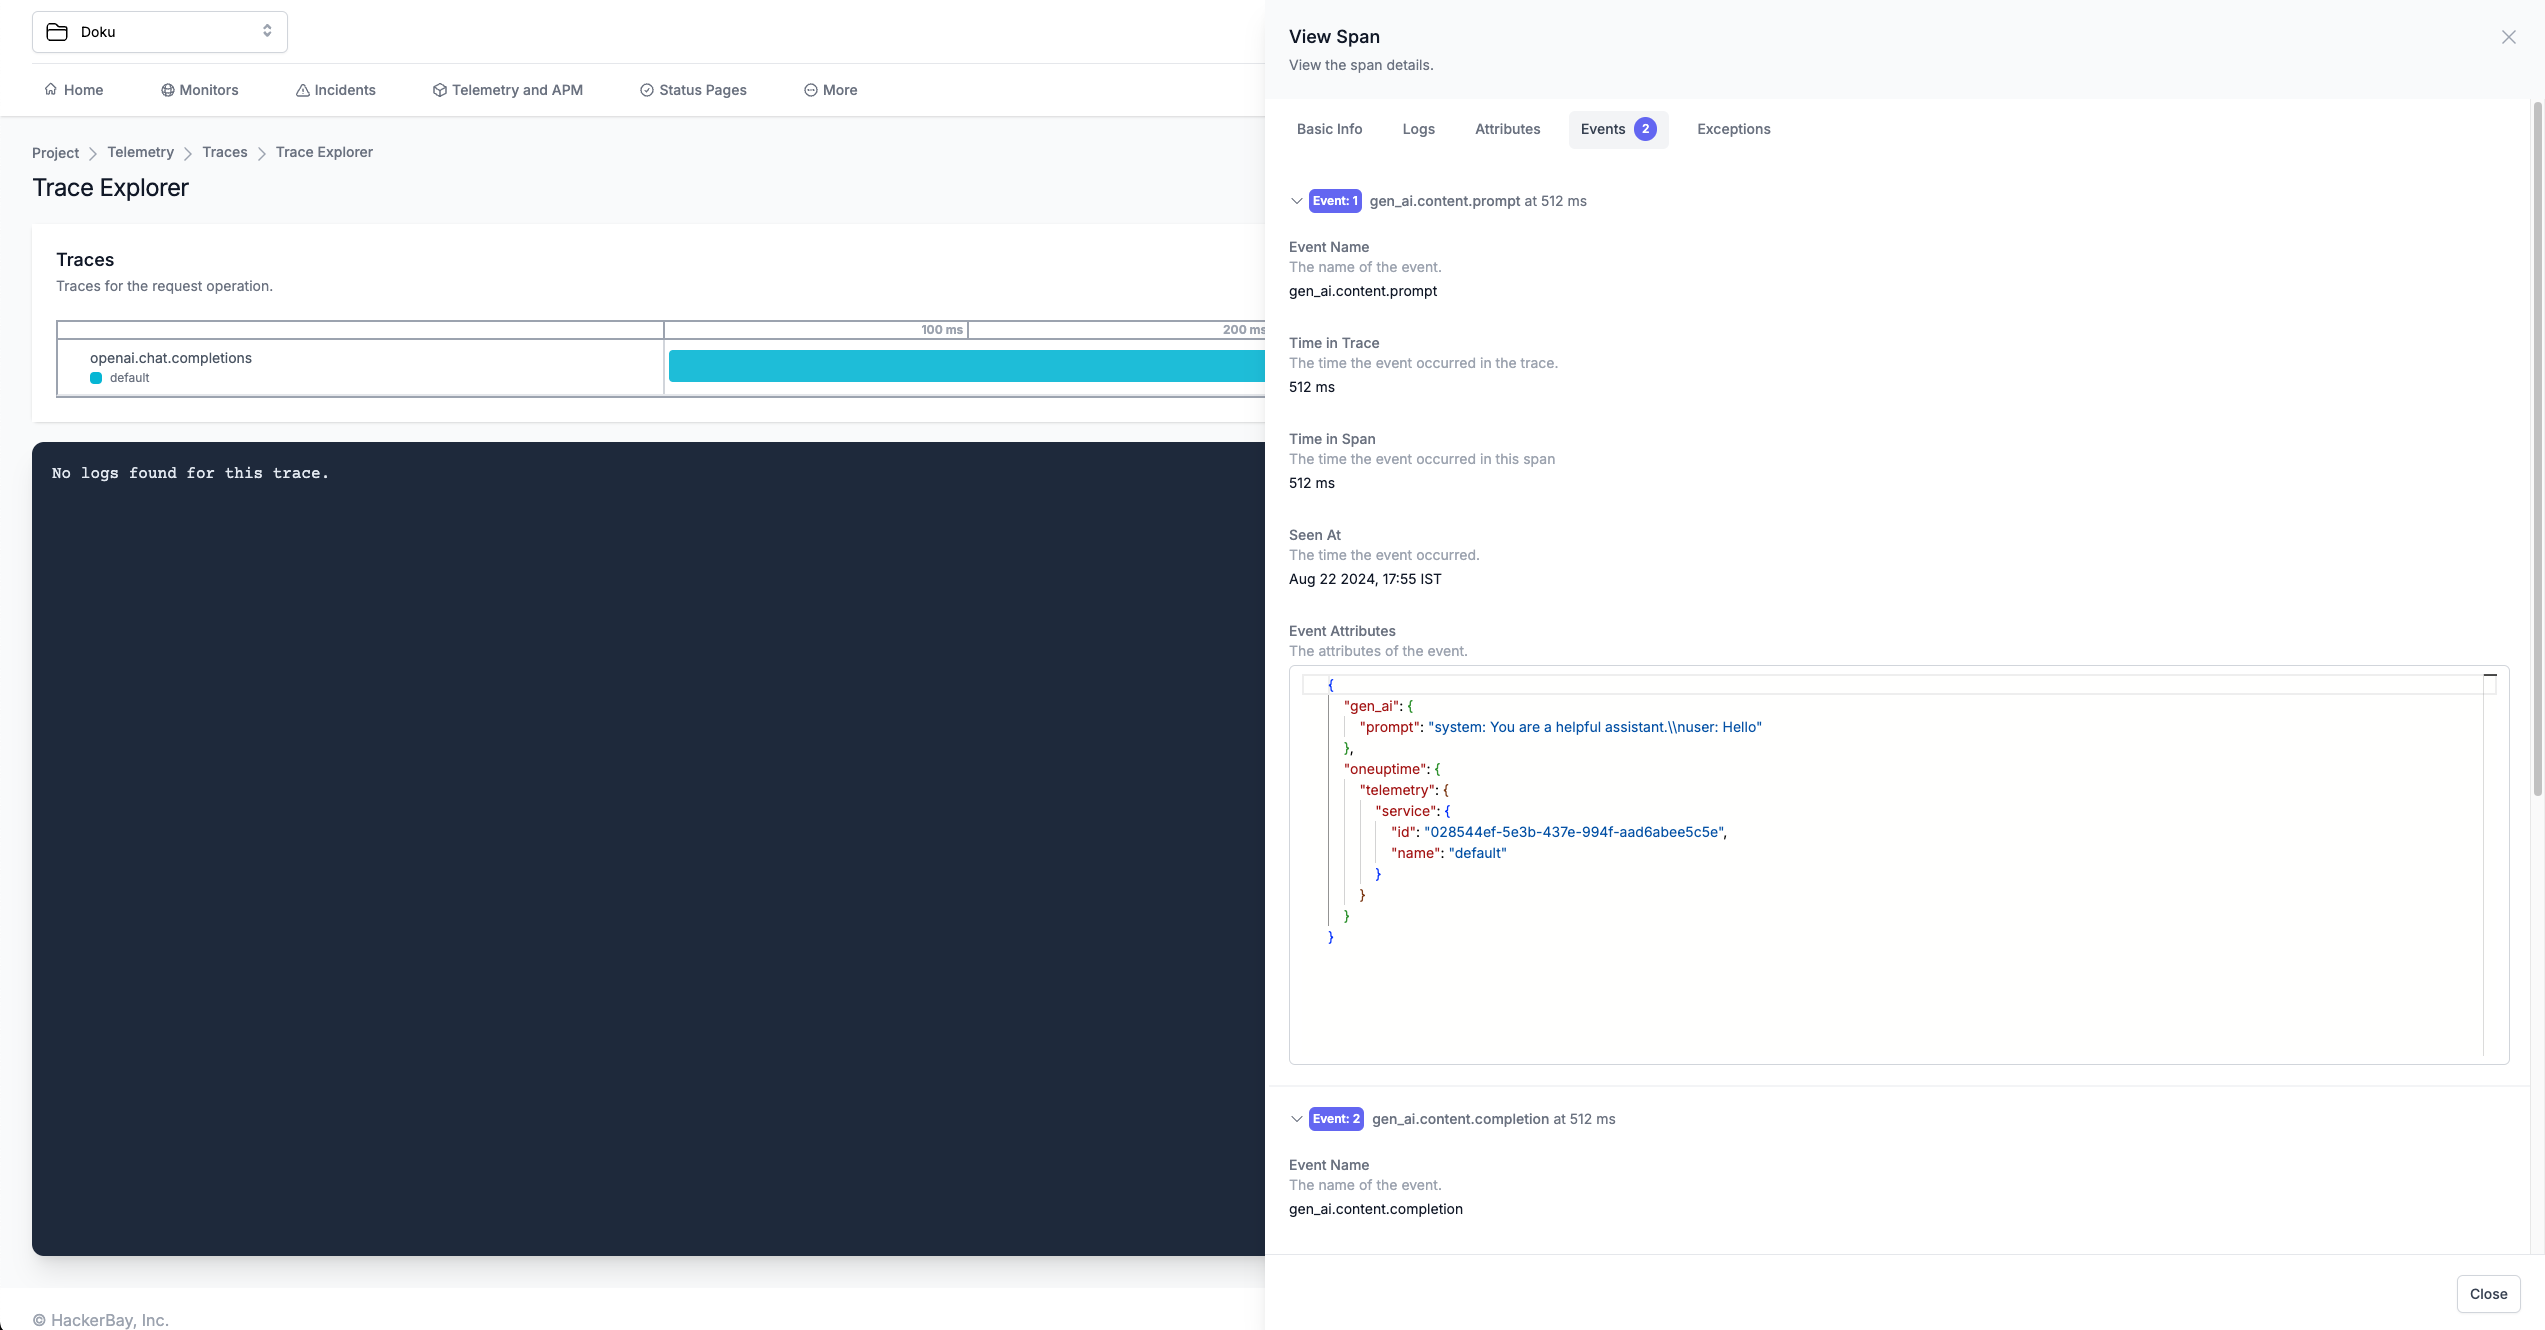
Once your LLM application is instrumented, you can explore the telemetry data in OneUptime:
1. **Navigate to Telemetry**: Go to your OneUptime project dashboard
2. **View Traces**: Check the **Telemetry Traces** page to see your AI application traces
To send OpenTelemetry metrics and traces generated by OpenLIT from your AI Application to OneUptime, follow the below steps.
### 1. Get your Credentials
1. **Sign in to your OneUptime account**
2. **Navigate to Project Settings**:
* Click on **More** in the Navigation bar
* Click on **Project Settings**
3. **Create Telemetry Ingestion Key**:
* On the Telemetry Ingestion Key page, click on **Create Ingestion Key** to create a token

4. **Copy the Token**:
* Once you created a token, click on **View** to view and copy the token

### 2. Instrument your application
**For direct integration into your Python applications:**
```python theme={null}
import openlit
openlit.init(
otlp_endpoint="https://otlp.oneuptime.com",
otlp_headers="x-oneuptime-token=YOUR_ONEUPTIME_SERVICE_TOKEN"
)
```
Replace:
1. `YOUR_ONEUPTIME_SERVICE_TOKEN` with the OneUptime Ingestion Key value you copied in Step 1.
```python theme={null}
import openlit
openlit.init()
```
Set these environment variables:
```shell theme={null}
export OTEL_EXPORTER_OTLP_ENDPOINT="https://otlp.oneuptime.com"
export OTEL_EXPORTER_OTLP_HEADERS="x-oneuptime-token=YOUR_ONEUPTIME_SERVICE_TOKEN"
```
Replace:
1. `YOUR_ONEUPTIME_SERVICE_TOKEN` with the OneUptime Ingestion Key value you copied in Step 1.
Refer to the OpenLIT [Python SDK repository](https://github.com/openlit/openlit/tree/main/sdk/python) for more advanced configurations and use cases.
**For zero-code auto-instrumentation via command line:**
```shell theme={null}
# Using CLI arguments
openlit-instrument \
--otlp-endpoint "https://otlp.oneuptime.com" \
--otlp-headers "x-oneuptime-token=YOUR_ONEUPTIME_SERVICE_TOKEN" \
--service-name "my-ai-service" \
--deployment-environment "production" \
python app.py
```
Replace:
1. `YOUR_ONEUPTIME_SERVICE_TOKEN` with the OneUptime Ingestion Key value you copied in Step 1.
```shell theme={null}
# Set environment variables (takes precedence over CLI args)
export OTEL_EXPORTER_OTLP_ENDPOINT="https://otlp.oneuptime.com"
export OTEL_EXPORTER_OTLP_HEADERS="x-oneuptime-token=YOUR_ONEUPTIME_SERVICE_TOKEN"
export OTEL_SERVICE_NAME="my-ai-service"
export OTEL_DEPLOYMENT_ENVIRONMENT="production"
# Run your application
openlit-instrument python app.py
```
Replace:
1. `YOUR_ONEUPTIME_SERVICE_TOKEN` with the OneUptime Ingestion Key value you copied in Step 1.
Refer to the OpenLIT [Python SDK repository](https://github.com/openlit/openlit/tree/main/sdk/python) for more advanced configurations and use cases.
### 3. Visualize in OneUptime
Once your LLM application is instrumented, you can explore the telemetry data in OneUptime:
1. **Navigate to Telemetry**: Go to your OneUptime project dashboard
2. **View Traces**: Check the **Telemetry Traces** page to see your AI application traces