> ## Documentation Index
> Fetch the complete documentation index at: https://docs.openlit.io/llms.txt
> Use this file to discover all available pages before exploring further.
# Langfuse
> LLM Observability with Langfuse and OpenLIT
To send OpenTelemetry traces generated by OpenLIT from your AI Application to Langfuse, follow the below steps.
Langfuse is an [OpenTelemetry backend](https://langfuse.com/docs/opentelemetry/example-openlit) that supports native trace ingestion from OpenTelemetry instrumentation libraries like OpenLIT.
### 1. Get your Credentials
1. **Sign up at Langfuse**: Go to [Langfuse Cloud](https://cloud.langfuse.com) or [deploy Langfuse self-hosted](https://langfuse.com/docs/deployment/self-host)
2. **Get your Project Keys**:
* **Public Key**: Your Langfuse public key (starts with `pk-lf-`)
* **Secret Key**: Your Langfuse secret key (starts with `sk-lf-`)
3. **Choose your data region**:
* **EU Region**: `https://cloud.langfuse.com/api/public/otel`
* **US Region**: `https://us.cloud.langfuse.com/api/public/otel`
* **Self-hosted**: `https://your-langfuse-instance.com/api/public/otel`
Save these credentials - you'll need them for authentication.
### 2. Instrument your application
**For direct integration into your Python applications:**
```python theme={null}
import openlit
import base64
# Create Base64 encoded auth header
LANGFUSE_PUBLIC_KEY = "pk-lf-..."
LANGFUSE_SECRET_KEY = "sk-lf-..."
LANGFUSE_AUTH = base64.b64encode(f"{LANGFUSE_PUBLIC_KEY}:{LANGFUSE_SECRET_KEY}".encode()).decode()
openlit.init(
otlp_endpoint="https://cloud.langfuse.com/api/public/otel",
otlp_headers=f"Authorization=Basic {LANGFUSE_AUTH}",
disable_batch=True # Process traces immediately for better Langfuse integration
)
```
Replace:
1. `LANGFUSE_PUBLIC_KEY` with your Langfuse public key from Step 1.
2. `LANGFUSE_SECRET_KEY` with your Langfuse secret key from Step 1.
3. Update the endpoint for your region:
* **EU**: `https://cloud.langfuse.com/api/public/otel`
* **US**: `https://us.cloud.langfuse.com/api/public/otel`
* **Self-hosted**: `https://your-langfuse-instance.com/api/public/otel`
```python theme={null}
import openlit
openlit.init()
```
Set these environment variables:
```shell theme={null}
# Create Base64 encoded auth (replace with your actual keys)
export LANGFUSE_PUBLIC_KEY="pk-lf-..."
export LANGFUSE_SECRET_KEY="sk-lf-..."
export LANGFUSE_AUTH=$(echo -n "$LANGFUSE_PUBLIC_KEY:$LANGFUSE_SECRET_KEY" | base64)
# Configure OpenTelemetry
export OTEL_EXPORTER_OTLP_ENDPOINT="https://cloud.langfuse.com/api/public/otel"
export OTEL_EXPORTER_OTLP_HEADERS="Authorization=Basic $LANGFUSE_AUTH"
export OTEL_SERVICE_NAME="my-ai-service"
export OTEL_DEPLOYMENT_ENVIRONMENT="production"
```
Replace:
1. `LANGFUSE_PUBLIC_KEY` and `LANGFUSE_SECRET_KEY` with your actual keys.
2. Update the endpoint for your region as needed.
Refer to the OpenLIT [Python SDK repository](https://github.com/openlit/openlit/tree/main/sdk/python) for more advanced configurations and use cases.
**For zero-code auto-instrumentation via command line:**
```shell theme={null}
# Create Base64 encoded auth (replace with your actual keys)
export LANGFUSE_PUBLIC_KEY="pk-lf-..."
export LANGFUSE_SECRET_KEY="sk-lf-..."
export LANGFUSE_AUTH=$(echo -n "$LANGFUSE_PUBLIC_KEY:$LANGFUSE_SECRET_KEY" | base64)
# Using CLI arguments
openlit-instrument \
--otlp-endpoint "https://cloud.langfuse.com/api/public/otel" \
--otlp-headers "Authorization=Basic $LANGFUSE_AUTH" \
--service-name "my-ai-service" \
--deployment-environment "production" \
--disable-batch \
python app.py
```
Replace:
1. `LANGFUSE_PUBLIC_KEY` and `LANGFUSE_SECRET_KEY` with your actual keys.
2. Update the endpoint for your region as needed.
```shell theme={null}
# Create Base64 encoded auth (replace with your actual keys)
export LANGFUSE_PUBLIC_KEY="pk-lf-..."
export LANGFUSE_SECRET_KEY="sk-lf-..."
export LANGFUSE_AUTH=$(echo -n "$LANGFUSE_PUBLIC_KEY:$LANGFUSE_SECRET_KEY" | base64)
# Set environment variables (takes precedence over CLI args)
export OTEL_EXPORTER_OTLP_ENDPOINT="https://cloud.langfuse.com/api/public/otel"
export OTEL_EXPORTER_OTLP_HEADERS="Authorization=Basic $LANGFUSE_AUTH"
export OTEL_SERVICE_NAME="my-ai-service"
export OTEL_DEPLOYMENT_ENVIRONMENT="production"
# Run your application
openlit-instrument python app.py
```
Replace:
1. `LANGFUSE_PUBLIC_KEY` and `LANGFUSE_SECRET_KEY` with your actual keys.
2. Update the endpoint for your region as needed.
Refer to the OpenLIT [Python SDK repository](https://github.com/openlit/openlit/tree/main/sdk/python) for more advanced configurations and use cases.
### 3. Visualize in Langfuse
Once your LLM application is instrumented, you can explore the telemetry data in Langfuse:
1. **Navigate to Langfuse**: Go to your [Langfuse Dashboard](https://cloud.langfuse.com) (or your self-hosted instance)
2. **Explore Traces**: Click on **Traces** in the sidebar to view your AI application traces
3. **View Detailed Traces**: Each trace includes:
* **LLM requests** with detailed timing and token usage
* **Model performance** analytics and latency metrics
* **Request/response payloads** for debugging
* **Cost tracking** and token consumption
* **Hierarchical spans** showing the complete request flow
4. **Sessions and Users**: Link traces to user sessions for comprehensive observability
5. **Datasets and Evaluations**: Use Langfuse's evaluation features to assess model performance
6. **Analytics Dashboard**: Monitor trends, costs, and performance over time
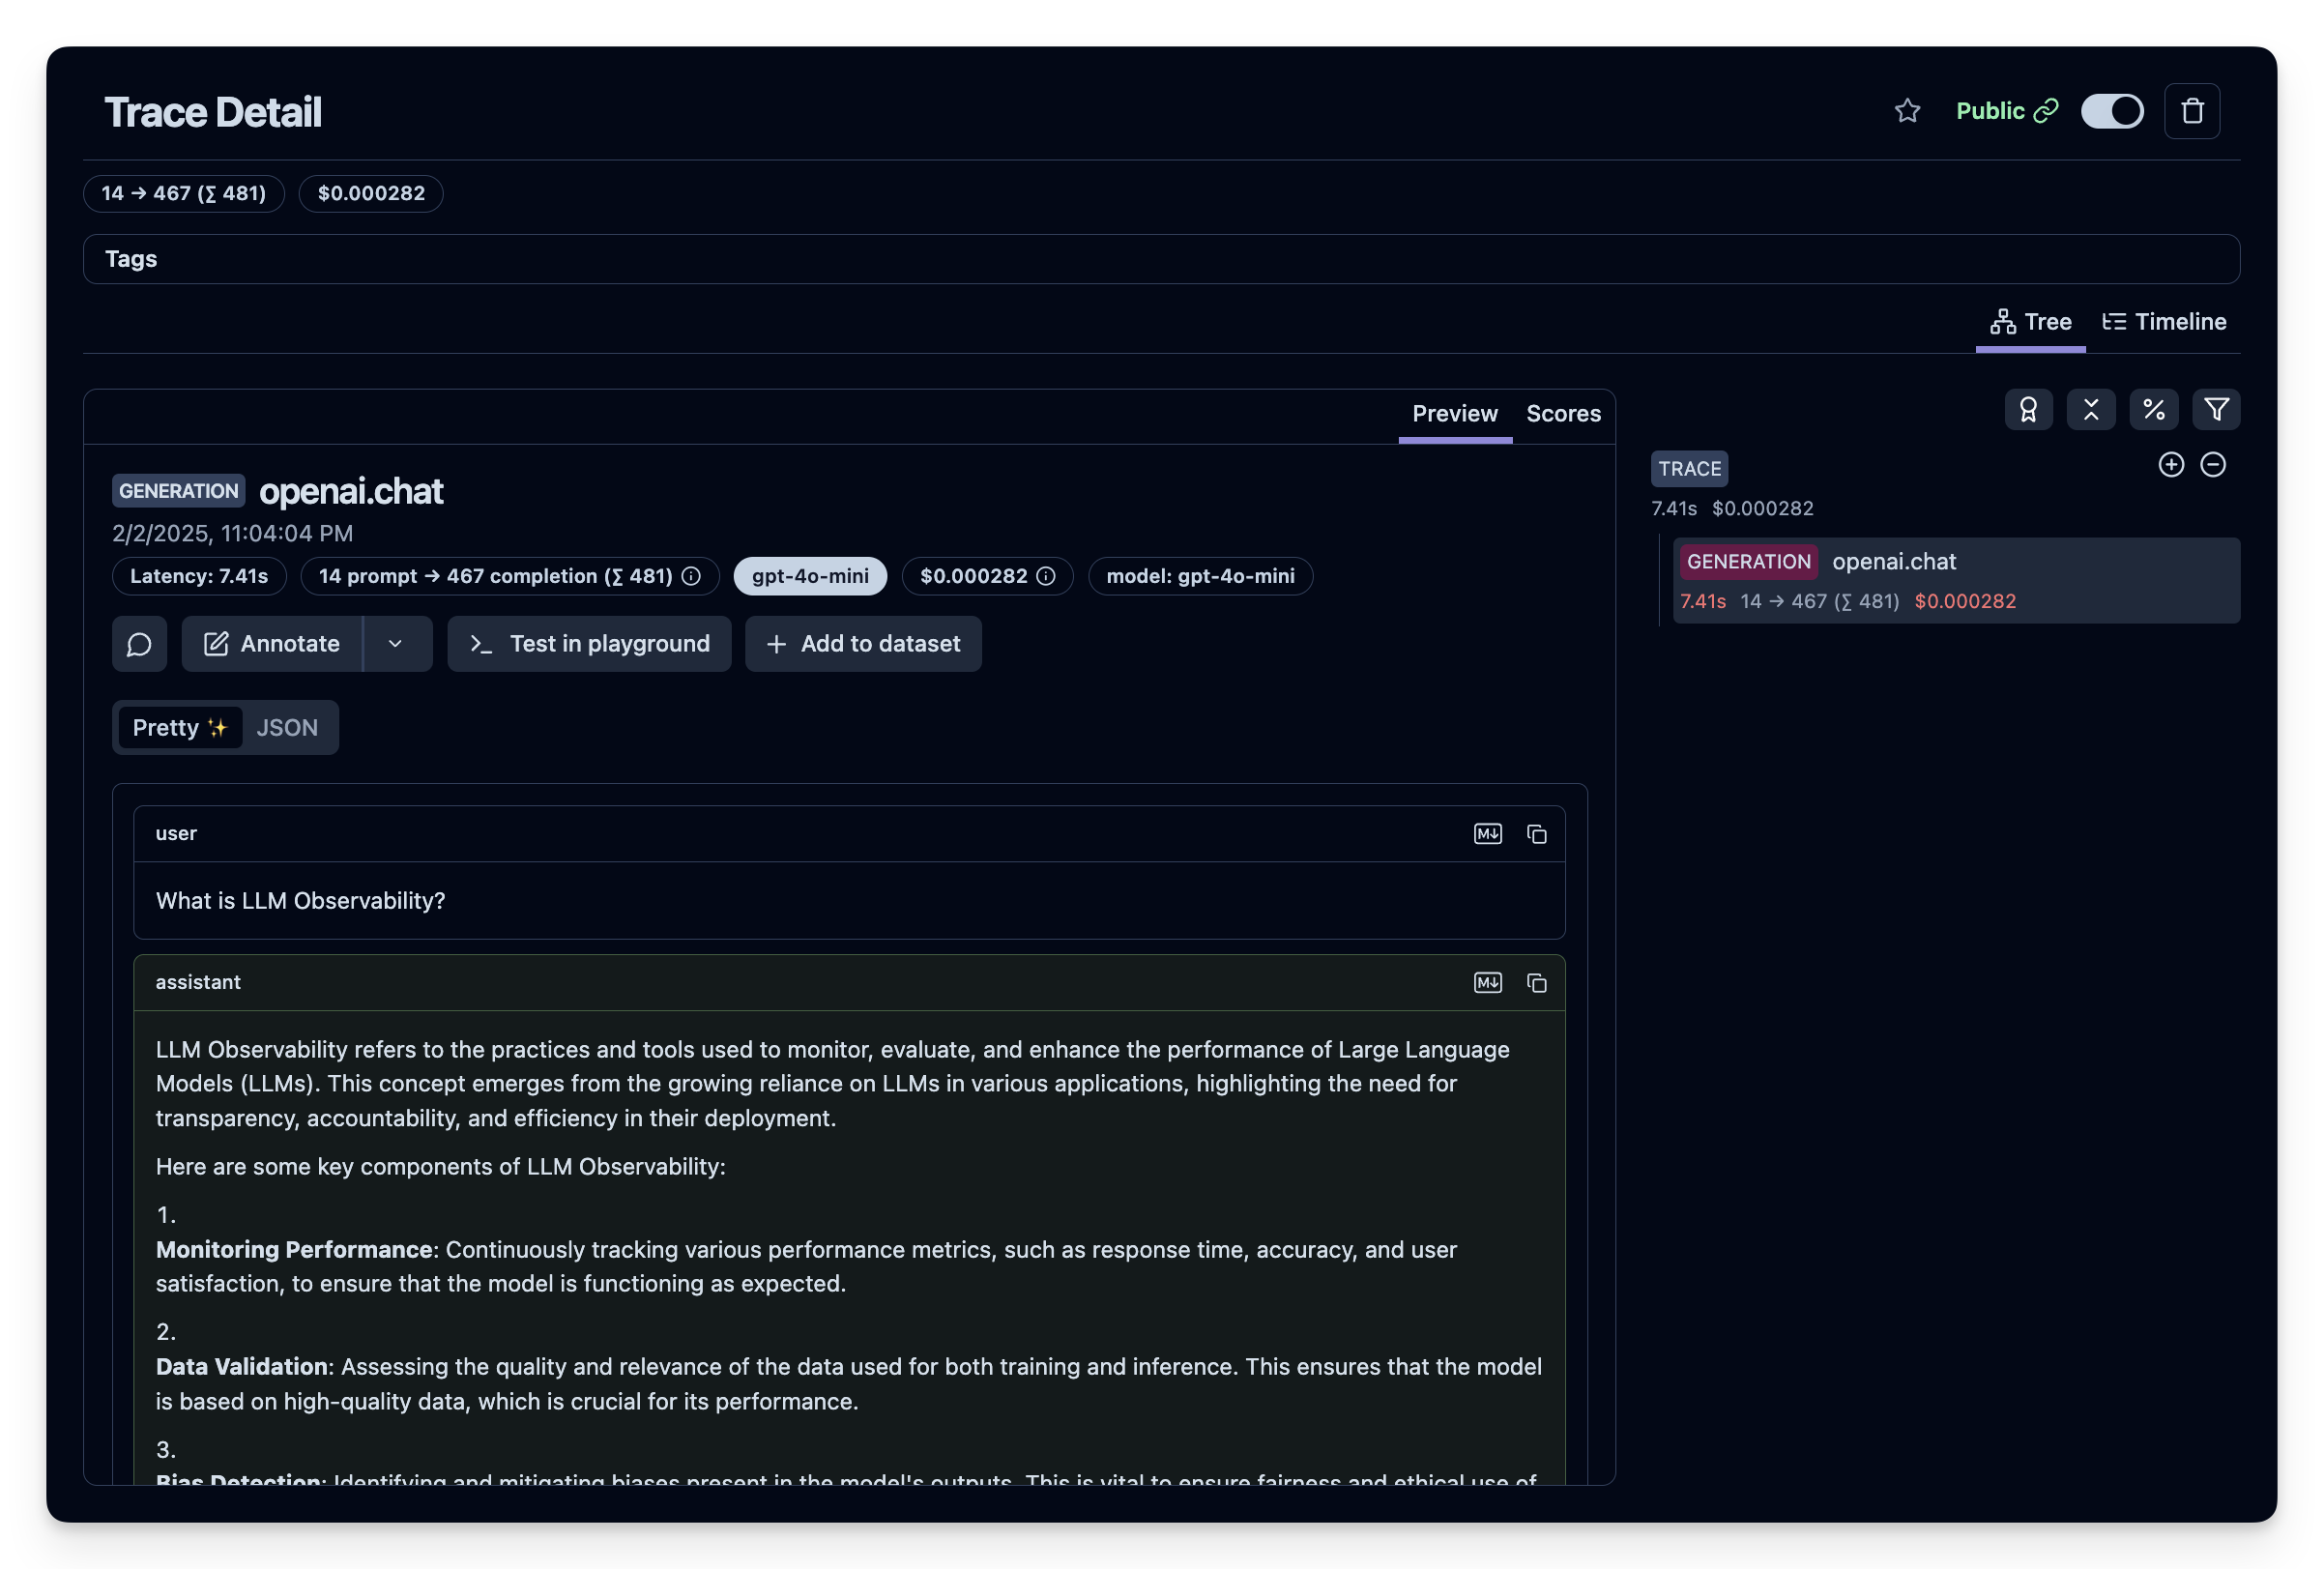 **Example**: You can view this [sample trace](https://cloud.langfuse.com/project/cloramnkj0002jz088vzn1ja4/traces/64902f6a5b4f27738be939b7ad38eab3?timestamp=2025-02-02T22%3A09%3A53.053Z) to see how OpenLIT traces appear in Langfuse.
Your OpenLIT-instrumented AI applications will appear automatically in Langfuse with comprehensive observability including LLM costs, token usage, model performance, and detailed execution traces with full context and debugging capabilities.
**Example**: You can view this [sample trace](https://cloud.langfuse.com/project/cloramnkj0002jz088vzn1ja4/traces/64902f6a5b4f27738be939b7ad38eab3?timestamp=2025-02-02T22%3A09%3A53.053Z) to see how OpenLIT traces appear in Langfuse.
Your OpenLIT-instrumented AI applications will appear automatically in Langfuse with comprehensive observability including LLM costs, token usage, model performance, and detailed execution traces with full context and debugging capabilities.