> ## Documentation Index
> Fetch the complete documentation index at: https://docs.openlit.io/llms.txt
> Use this file to discover all available pages before exploring further.
# Errors
> View all error traces in one place with filtering and detailed exception information.
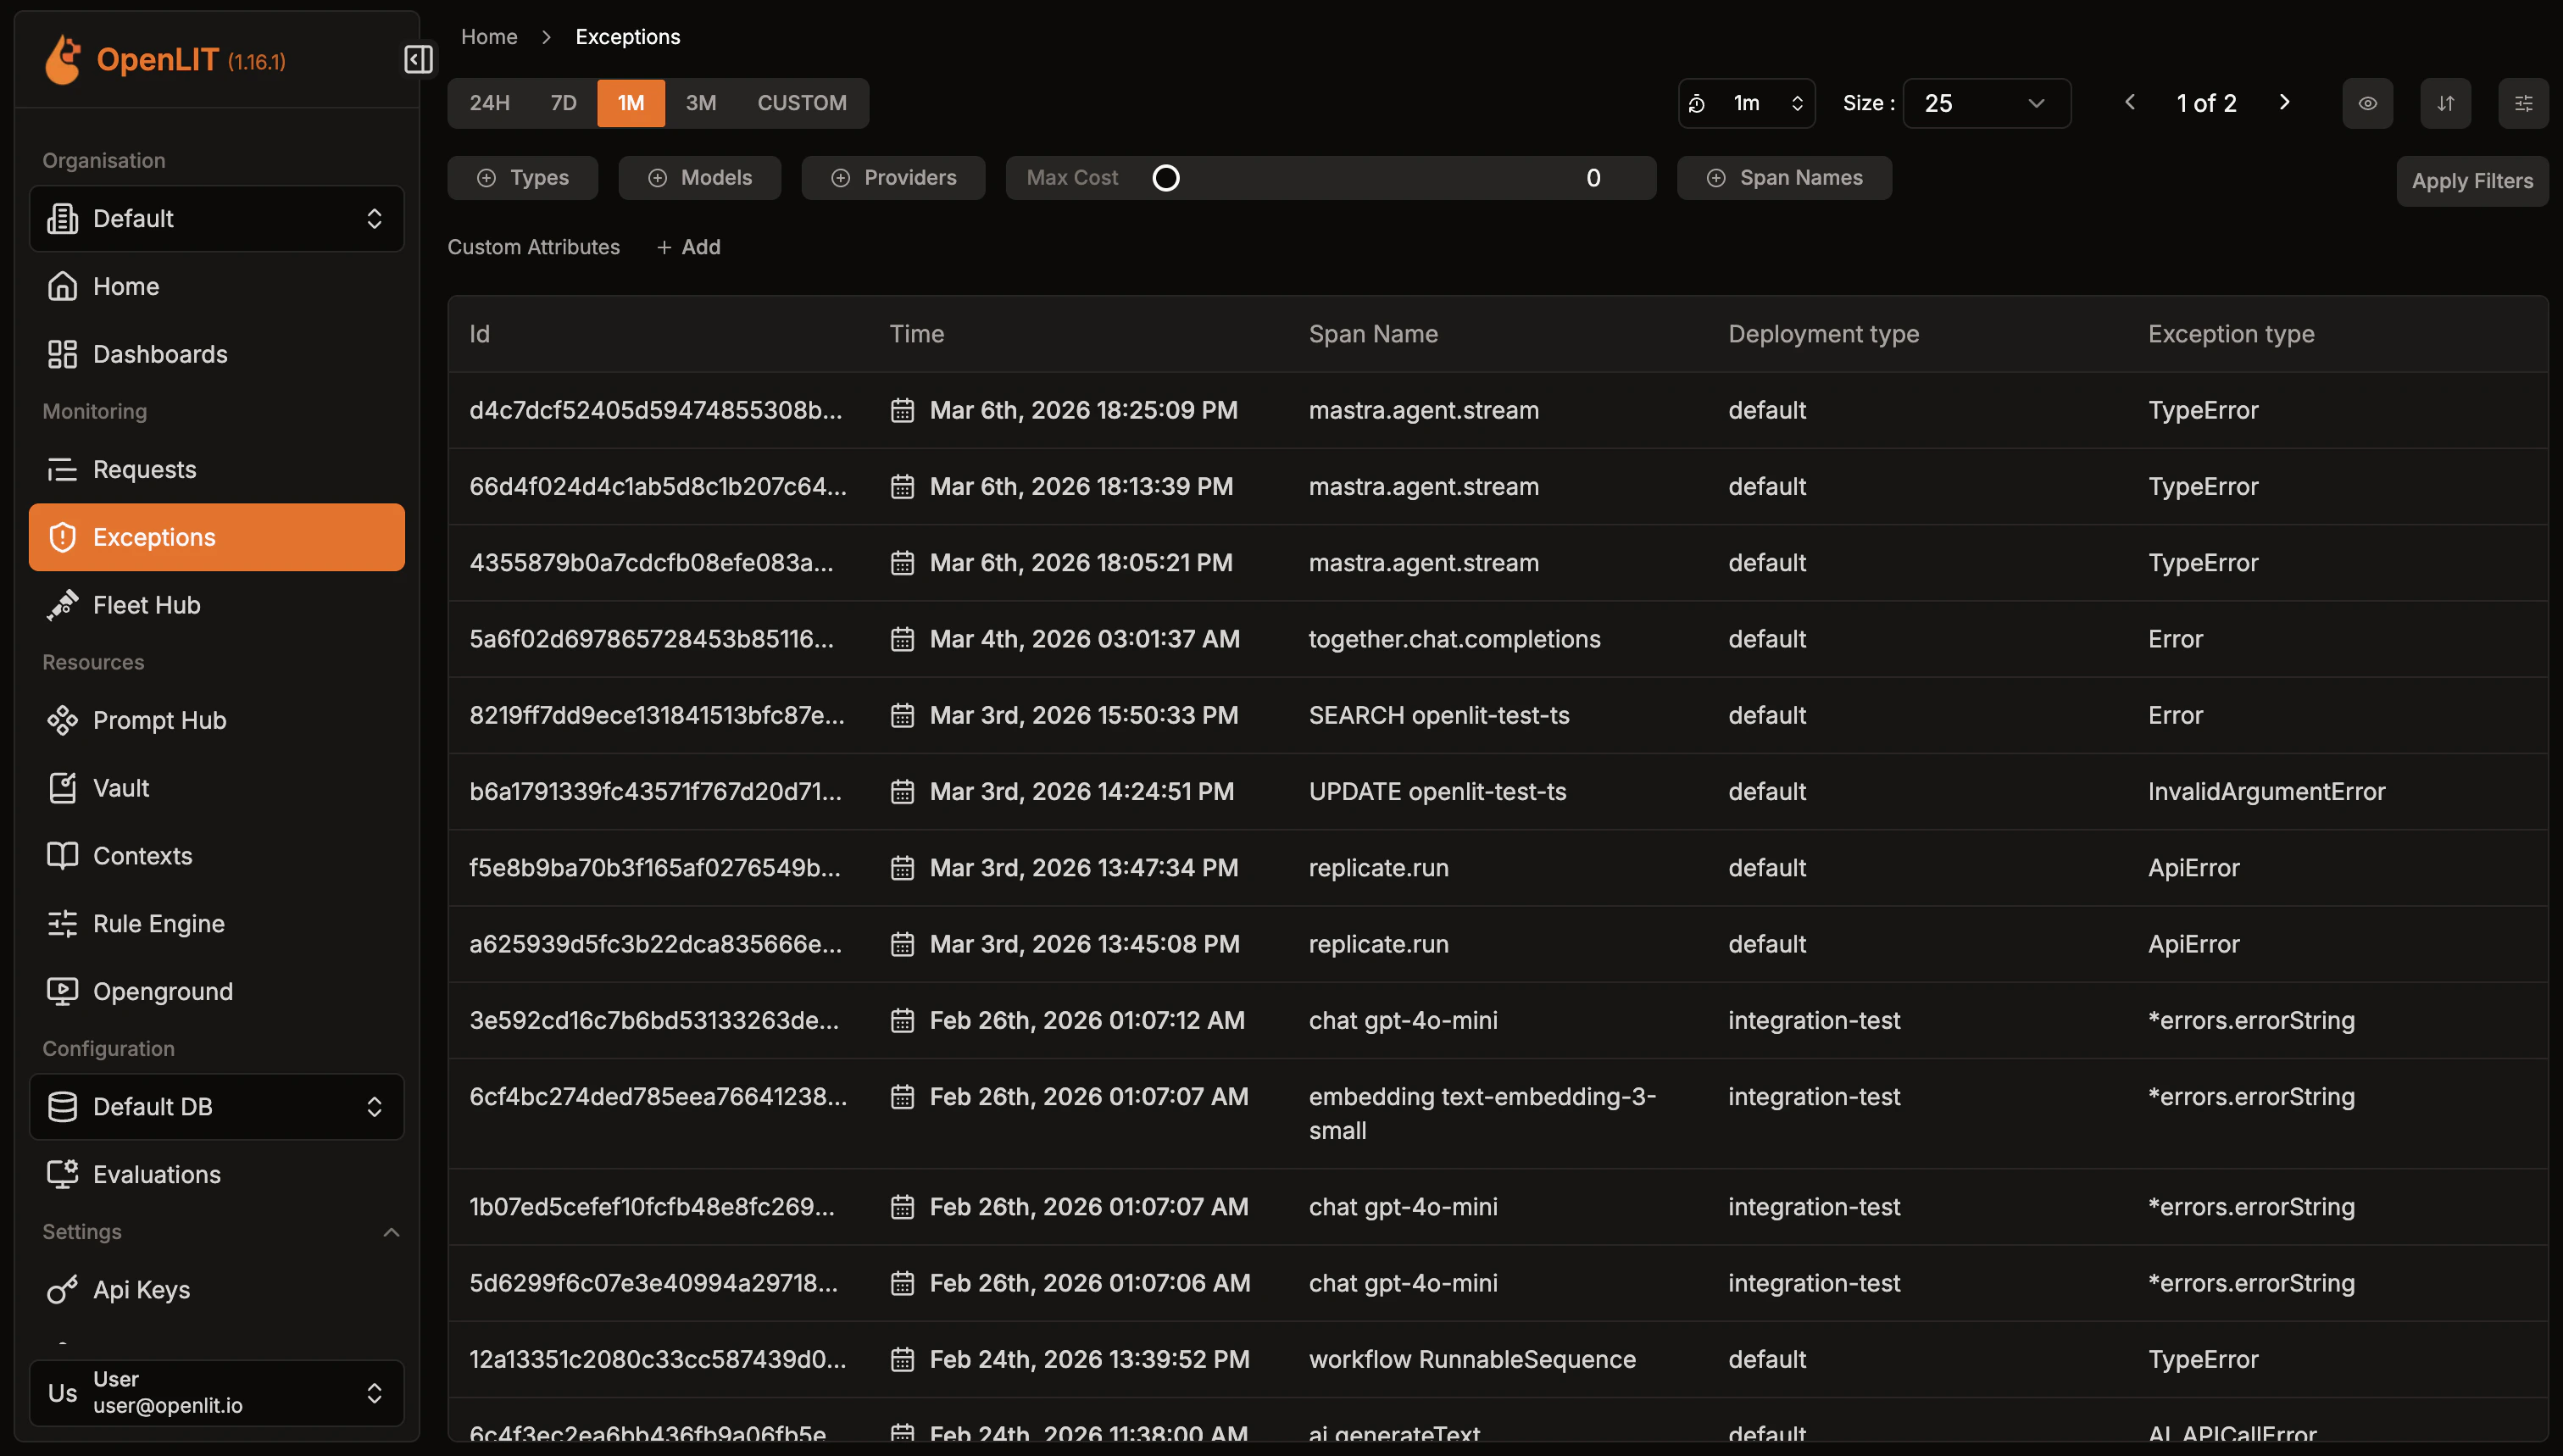
The Exceptions page shows all traces that contain errors or exceptions from your AI applications. You can filter by time range and exception type to quickly find and debug issues.
 ## Error traces
All error traces are automatically captured and displayed here, including:
* **LLM API errors**: Authentication, rate limits, model issues
* **Framework errors**: LangChain, LlamaIndex execution failures
* **Vector database errors**: Connection and query issues
* **Application errors**: Custom exceptions and validation errors
## Filtering
Use the time range selector to filter errors by period (24H, 7D, 1M, 3M, or custom range). Each error shows the trace ID, timestamp, span name, deployment type, and specific exception type.
## Exception details
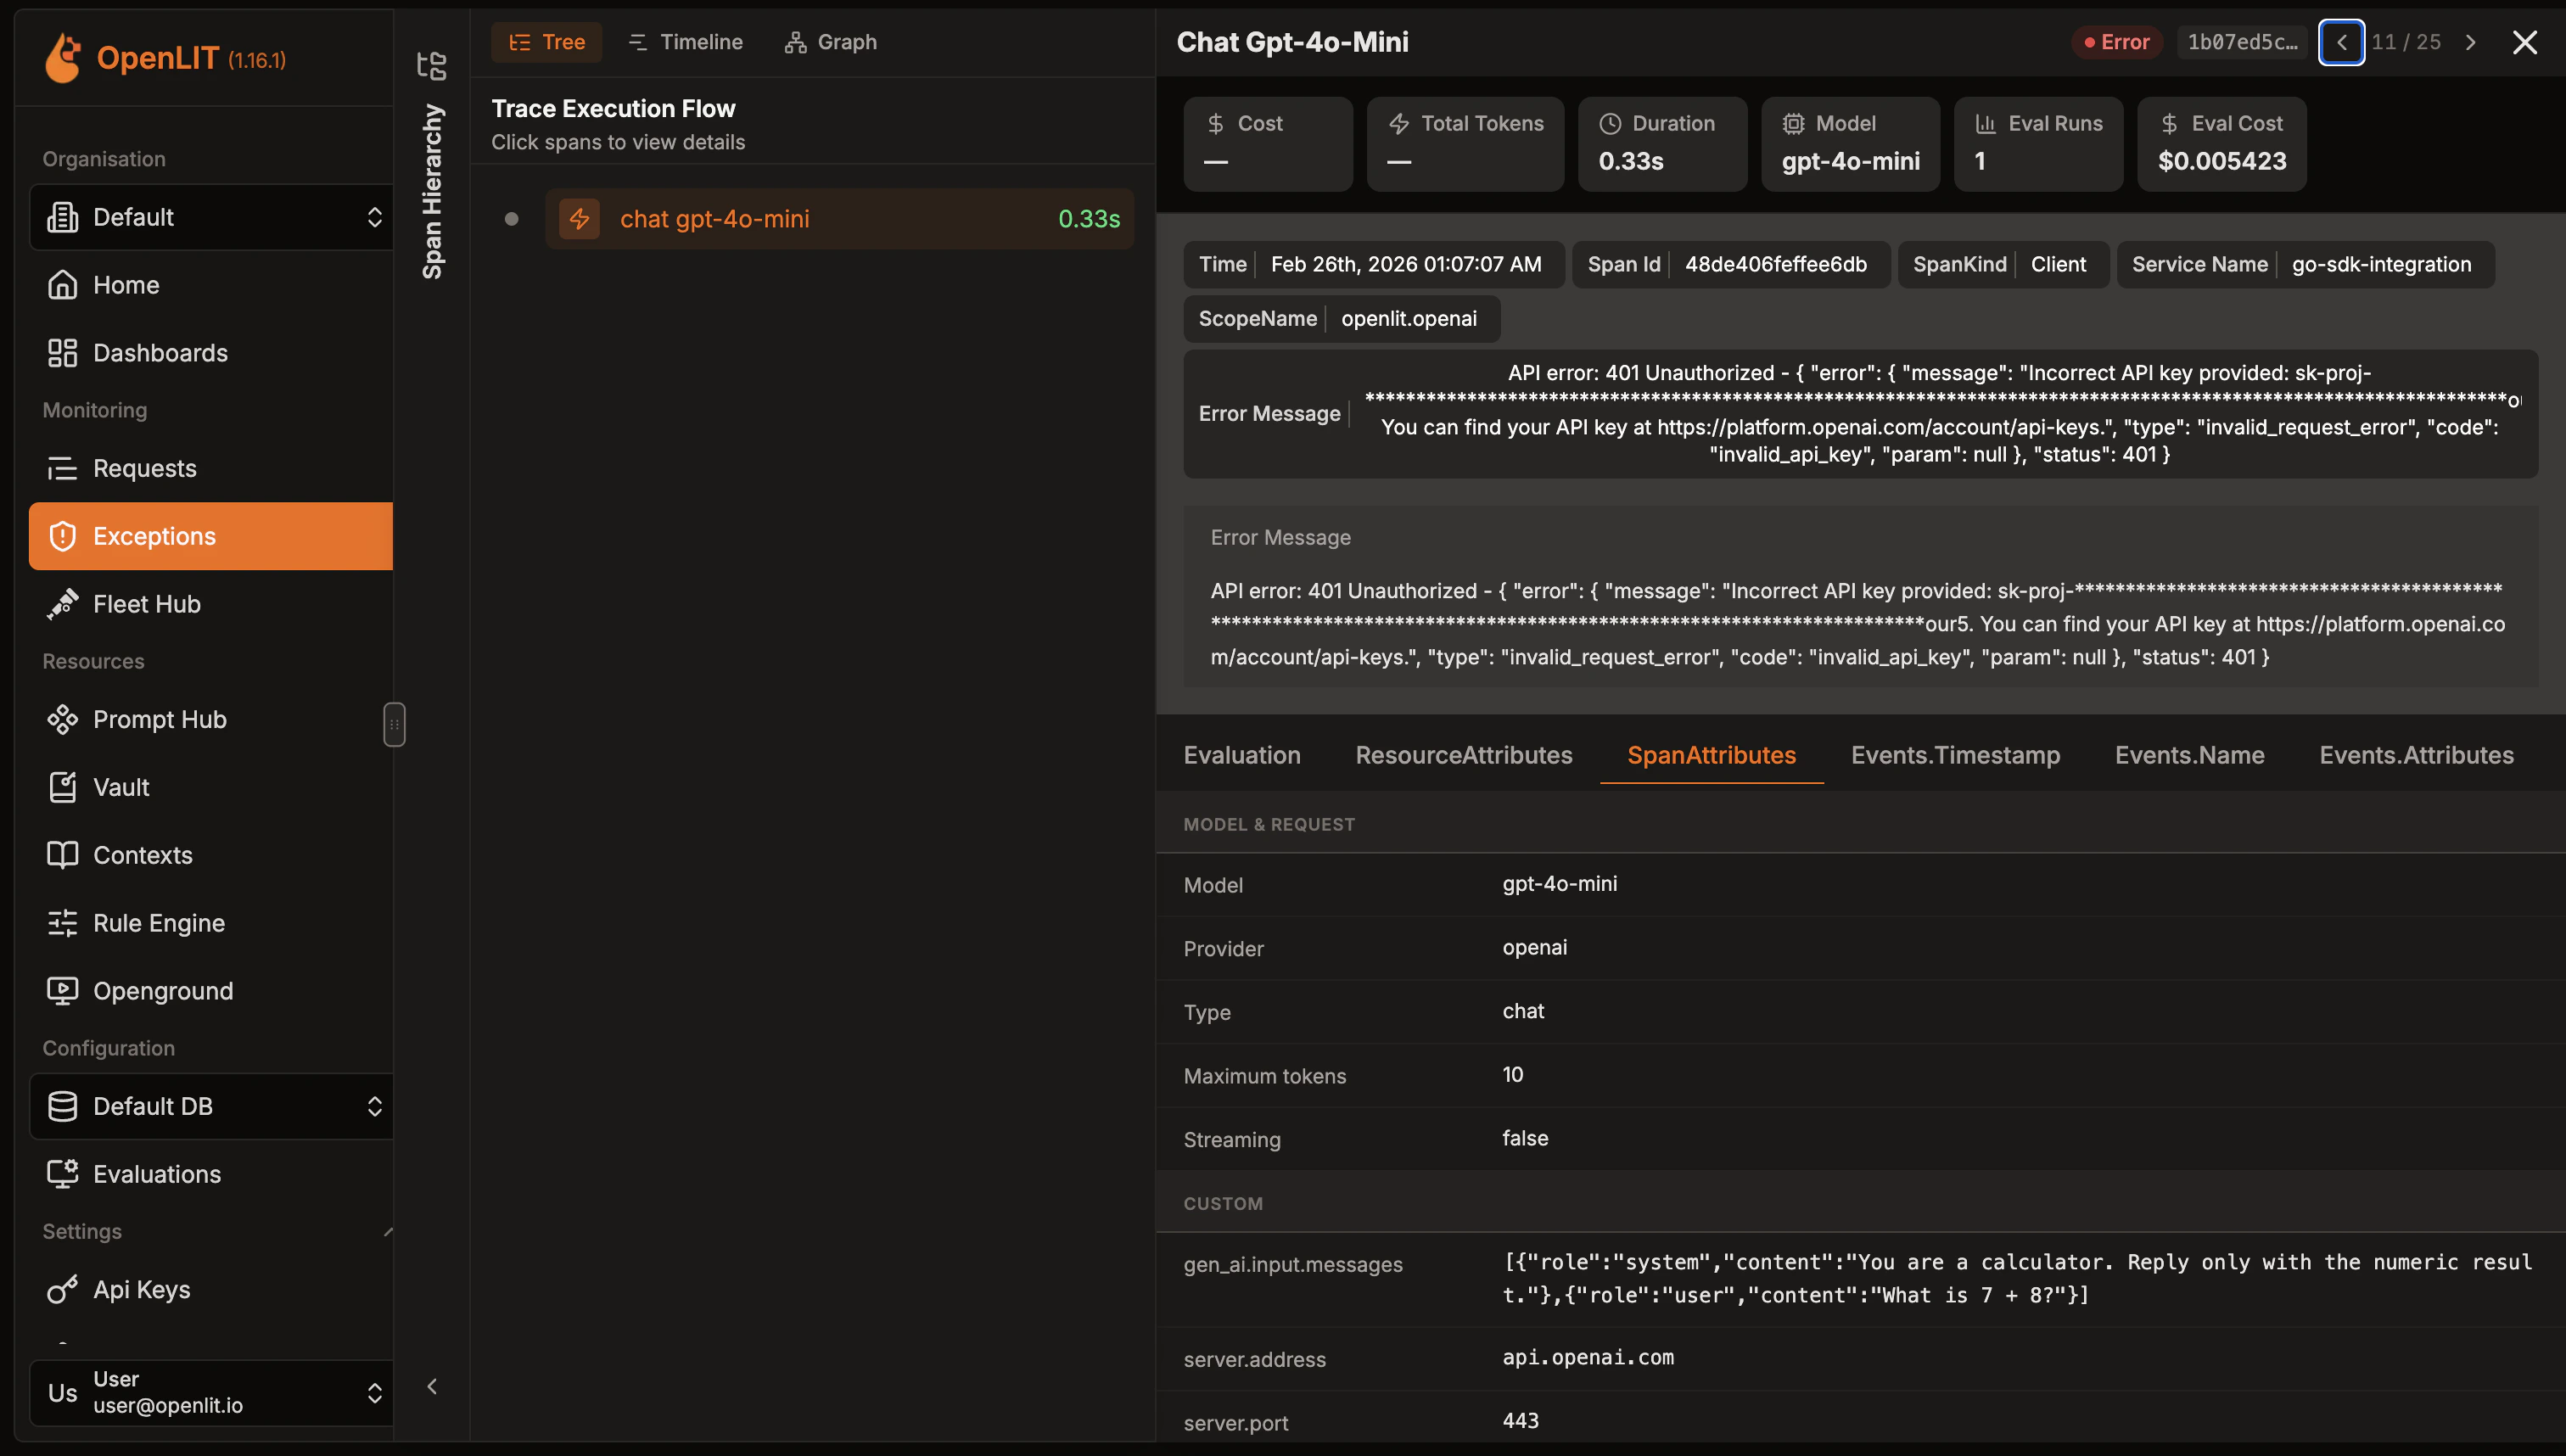
Click any error to view the complete trace context with detailed exception information, stack traces, and execution flow.
## Error traces
All error traces are automatically captured and displayed here, including:
* **LLM API errors**: Authentication, rate limits, model issues
* **Framework errors**: LangChain, LlamaIndex execution failures
* **Vector database errors**: Connection and query issues
* **Application errors**: Custom exceptions and validation errors
## Filtering
Use the time range selector to filter errors by period (24H, 7D, 1M, 3M, or custom range). Each error shows the trace ID, timestamp, span name, deployment type, and specific exception type.
## Exception details
Click any error to view the complete trace context with detailed exception information, stack traces, and execution flow.
 ***
Production-ready AI monitoring setup in 2 simple steps with zero code changes
Create custom visualizations with flexible widgets, queries, and real-time AI monitoring
60+ AI integrations with automatic instrumentation and performance tracking
Discover and instrument LLM traffic across Kubernetes, Docker, and Linux using eBPF — no code changes required.
***
Production-ready AI monitoring setup in 2 simple steps with zero code changes
Create custom visualizations with flexible widgets, queries, and real-time AI monitoring
60+ AI integrations with automatic instrumentation and performance tracking
Discover and instrument LLM traffic across Kubernetes, Docker, and Linux using eBPF — no code changes required.