> ## Documentation Index
> Fetch the complete documentation index at: https://docs.openlit.io/llms.txt
> Use this file to discover all available pages before exploring further.
# Create Dashboard
> Learn how to create dashboards in OpenLIT with step-by-step instructions for adding widgets, configuring visualizations, and building effective monitoring visualizations.
## Steps
1. Navigate to the **Dashboards** section in the main navigation
2. Click the **Create new dashboard** button in the top right corner
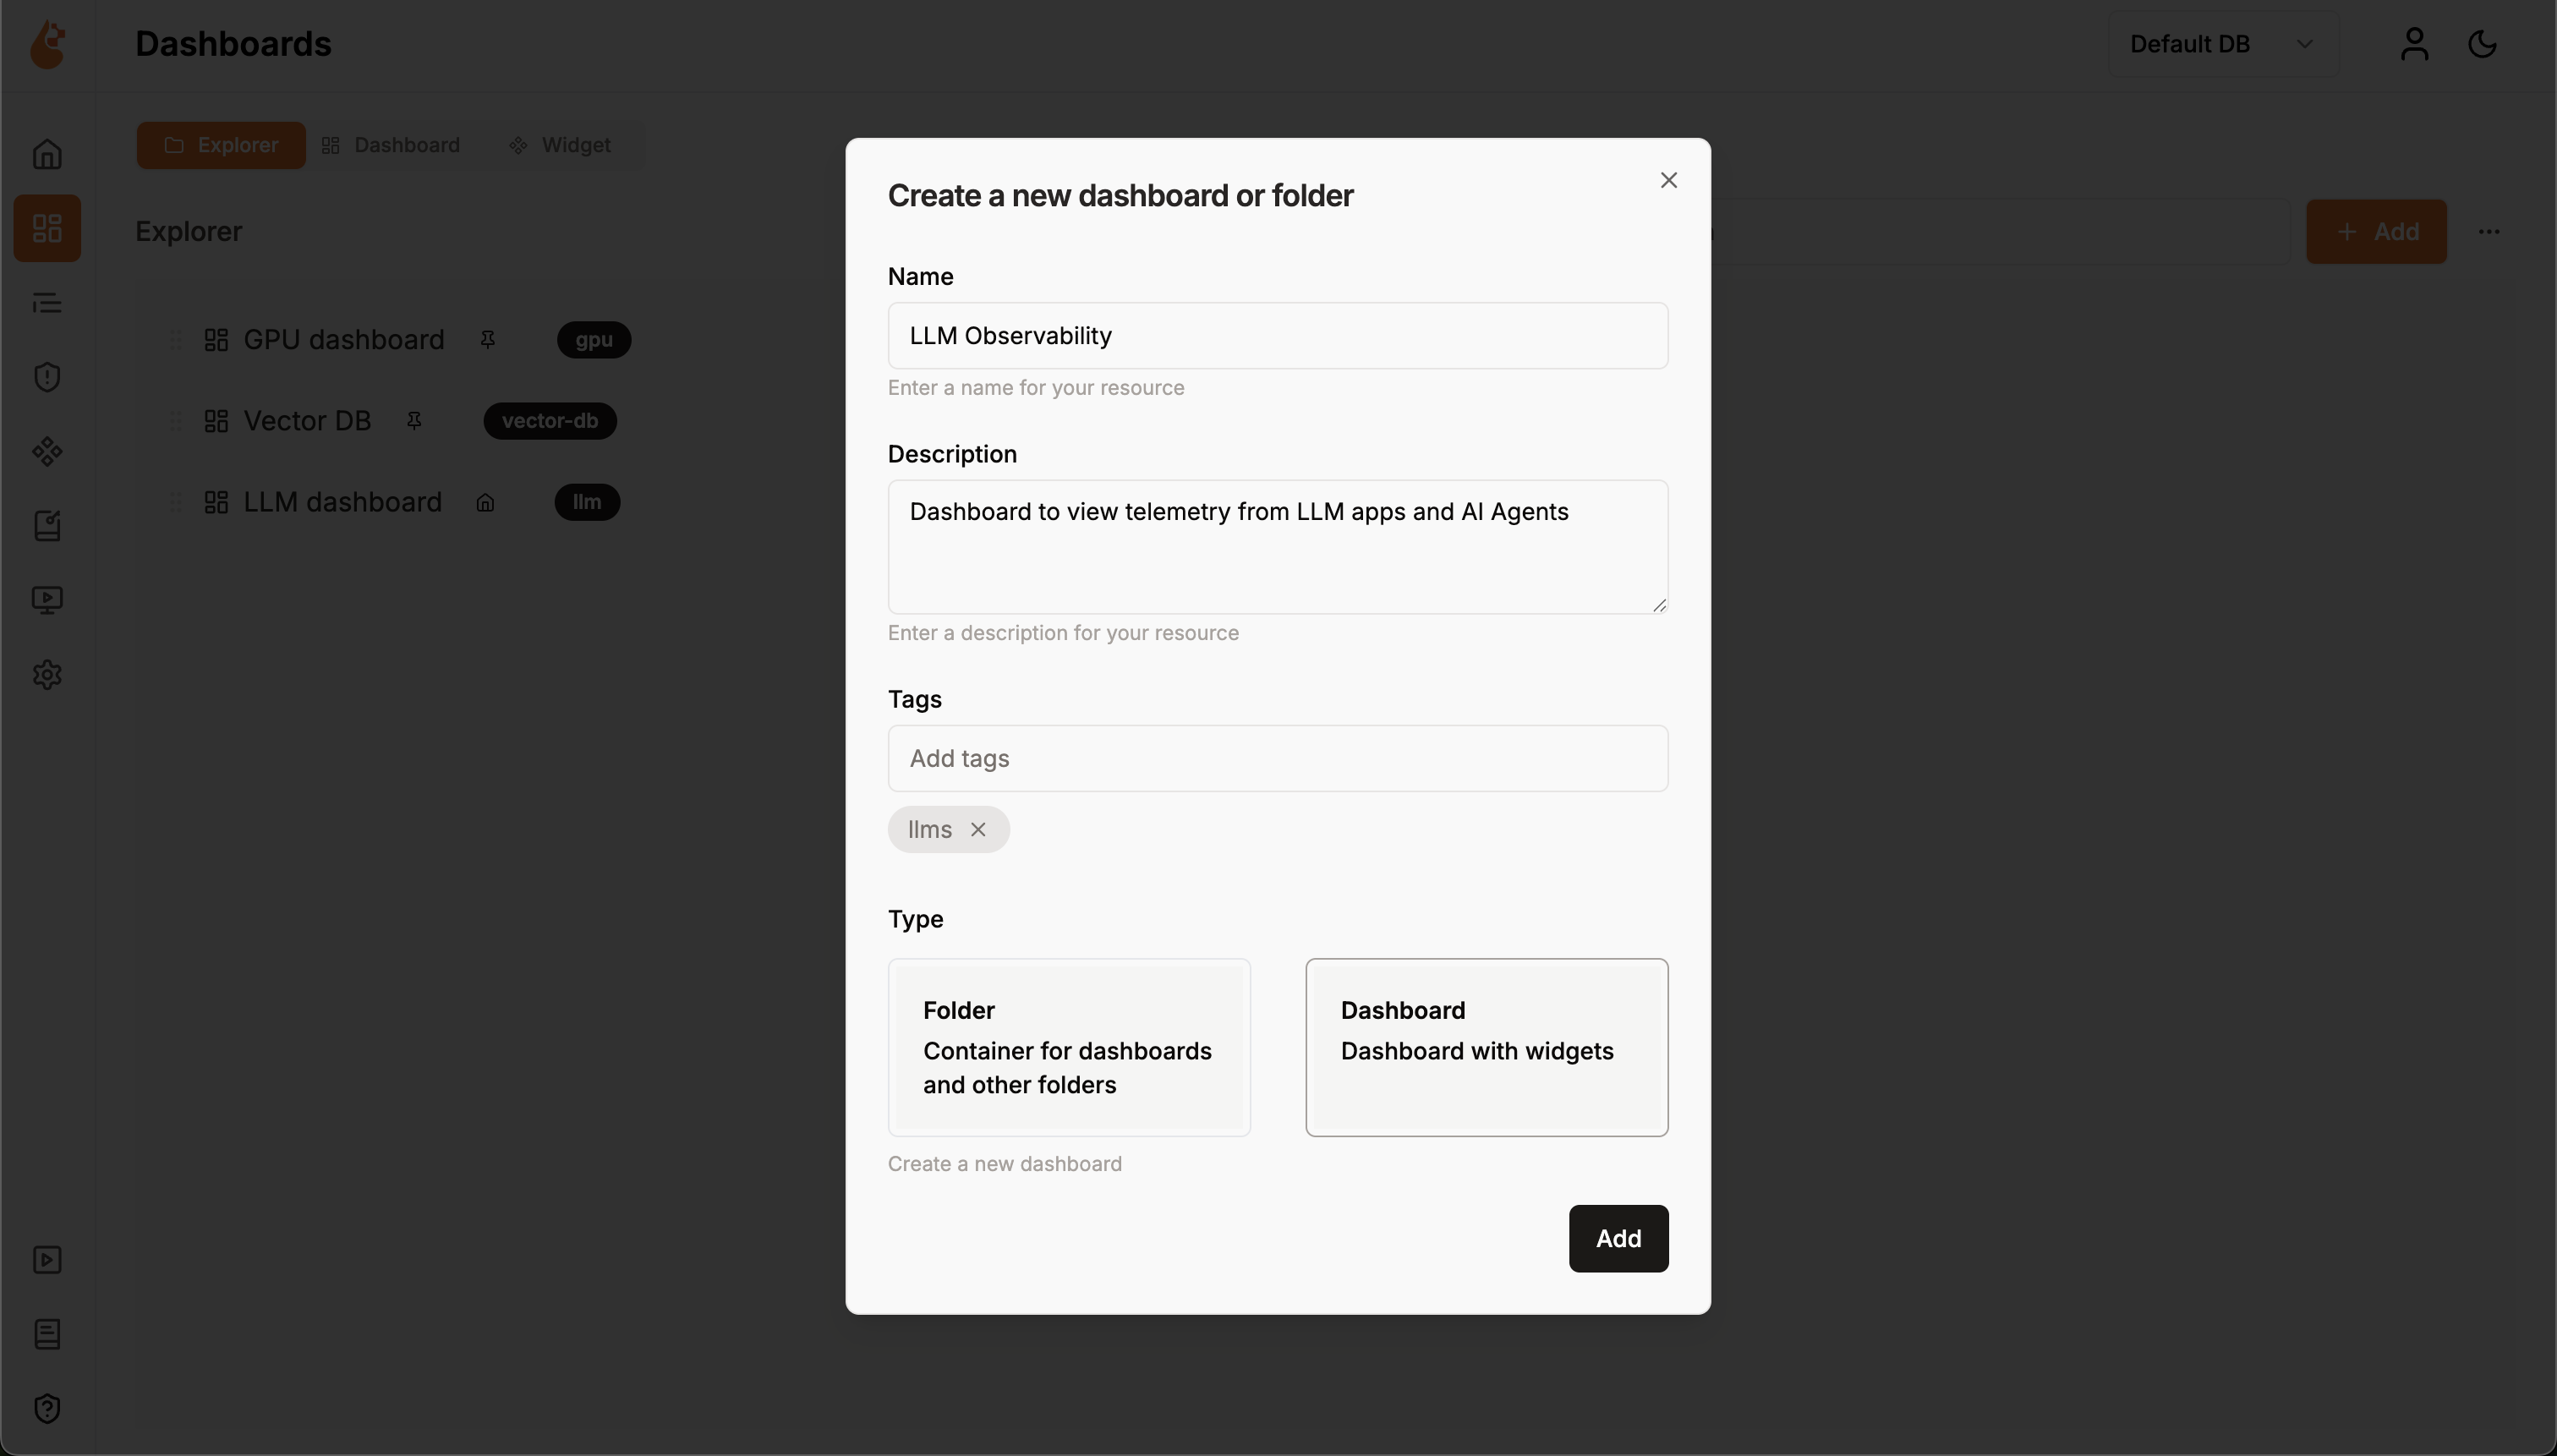
3. A **"Create a new dashboard or folder"** popup will appear
4. **Fill in the dashboard details**:
* **Name**: Enter a descriptive name (e.g., "LLM Observability")
* **Description**: Describe the dashboard's purpose (e.g., "Dashboard to view telemetry from LLM apps and AI Agents")
* **Tags**: Add relevant tags for organization and searchability
* **Type**: Select **Dashboard** (Dashboard with widgets)
5. Click the **Add** button to create your dashboard
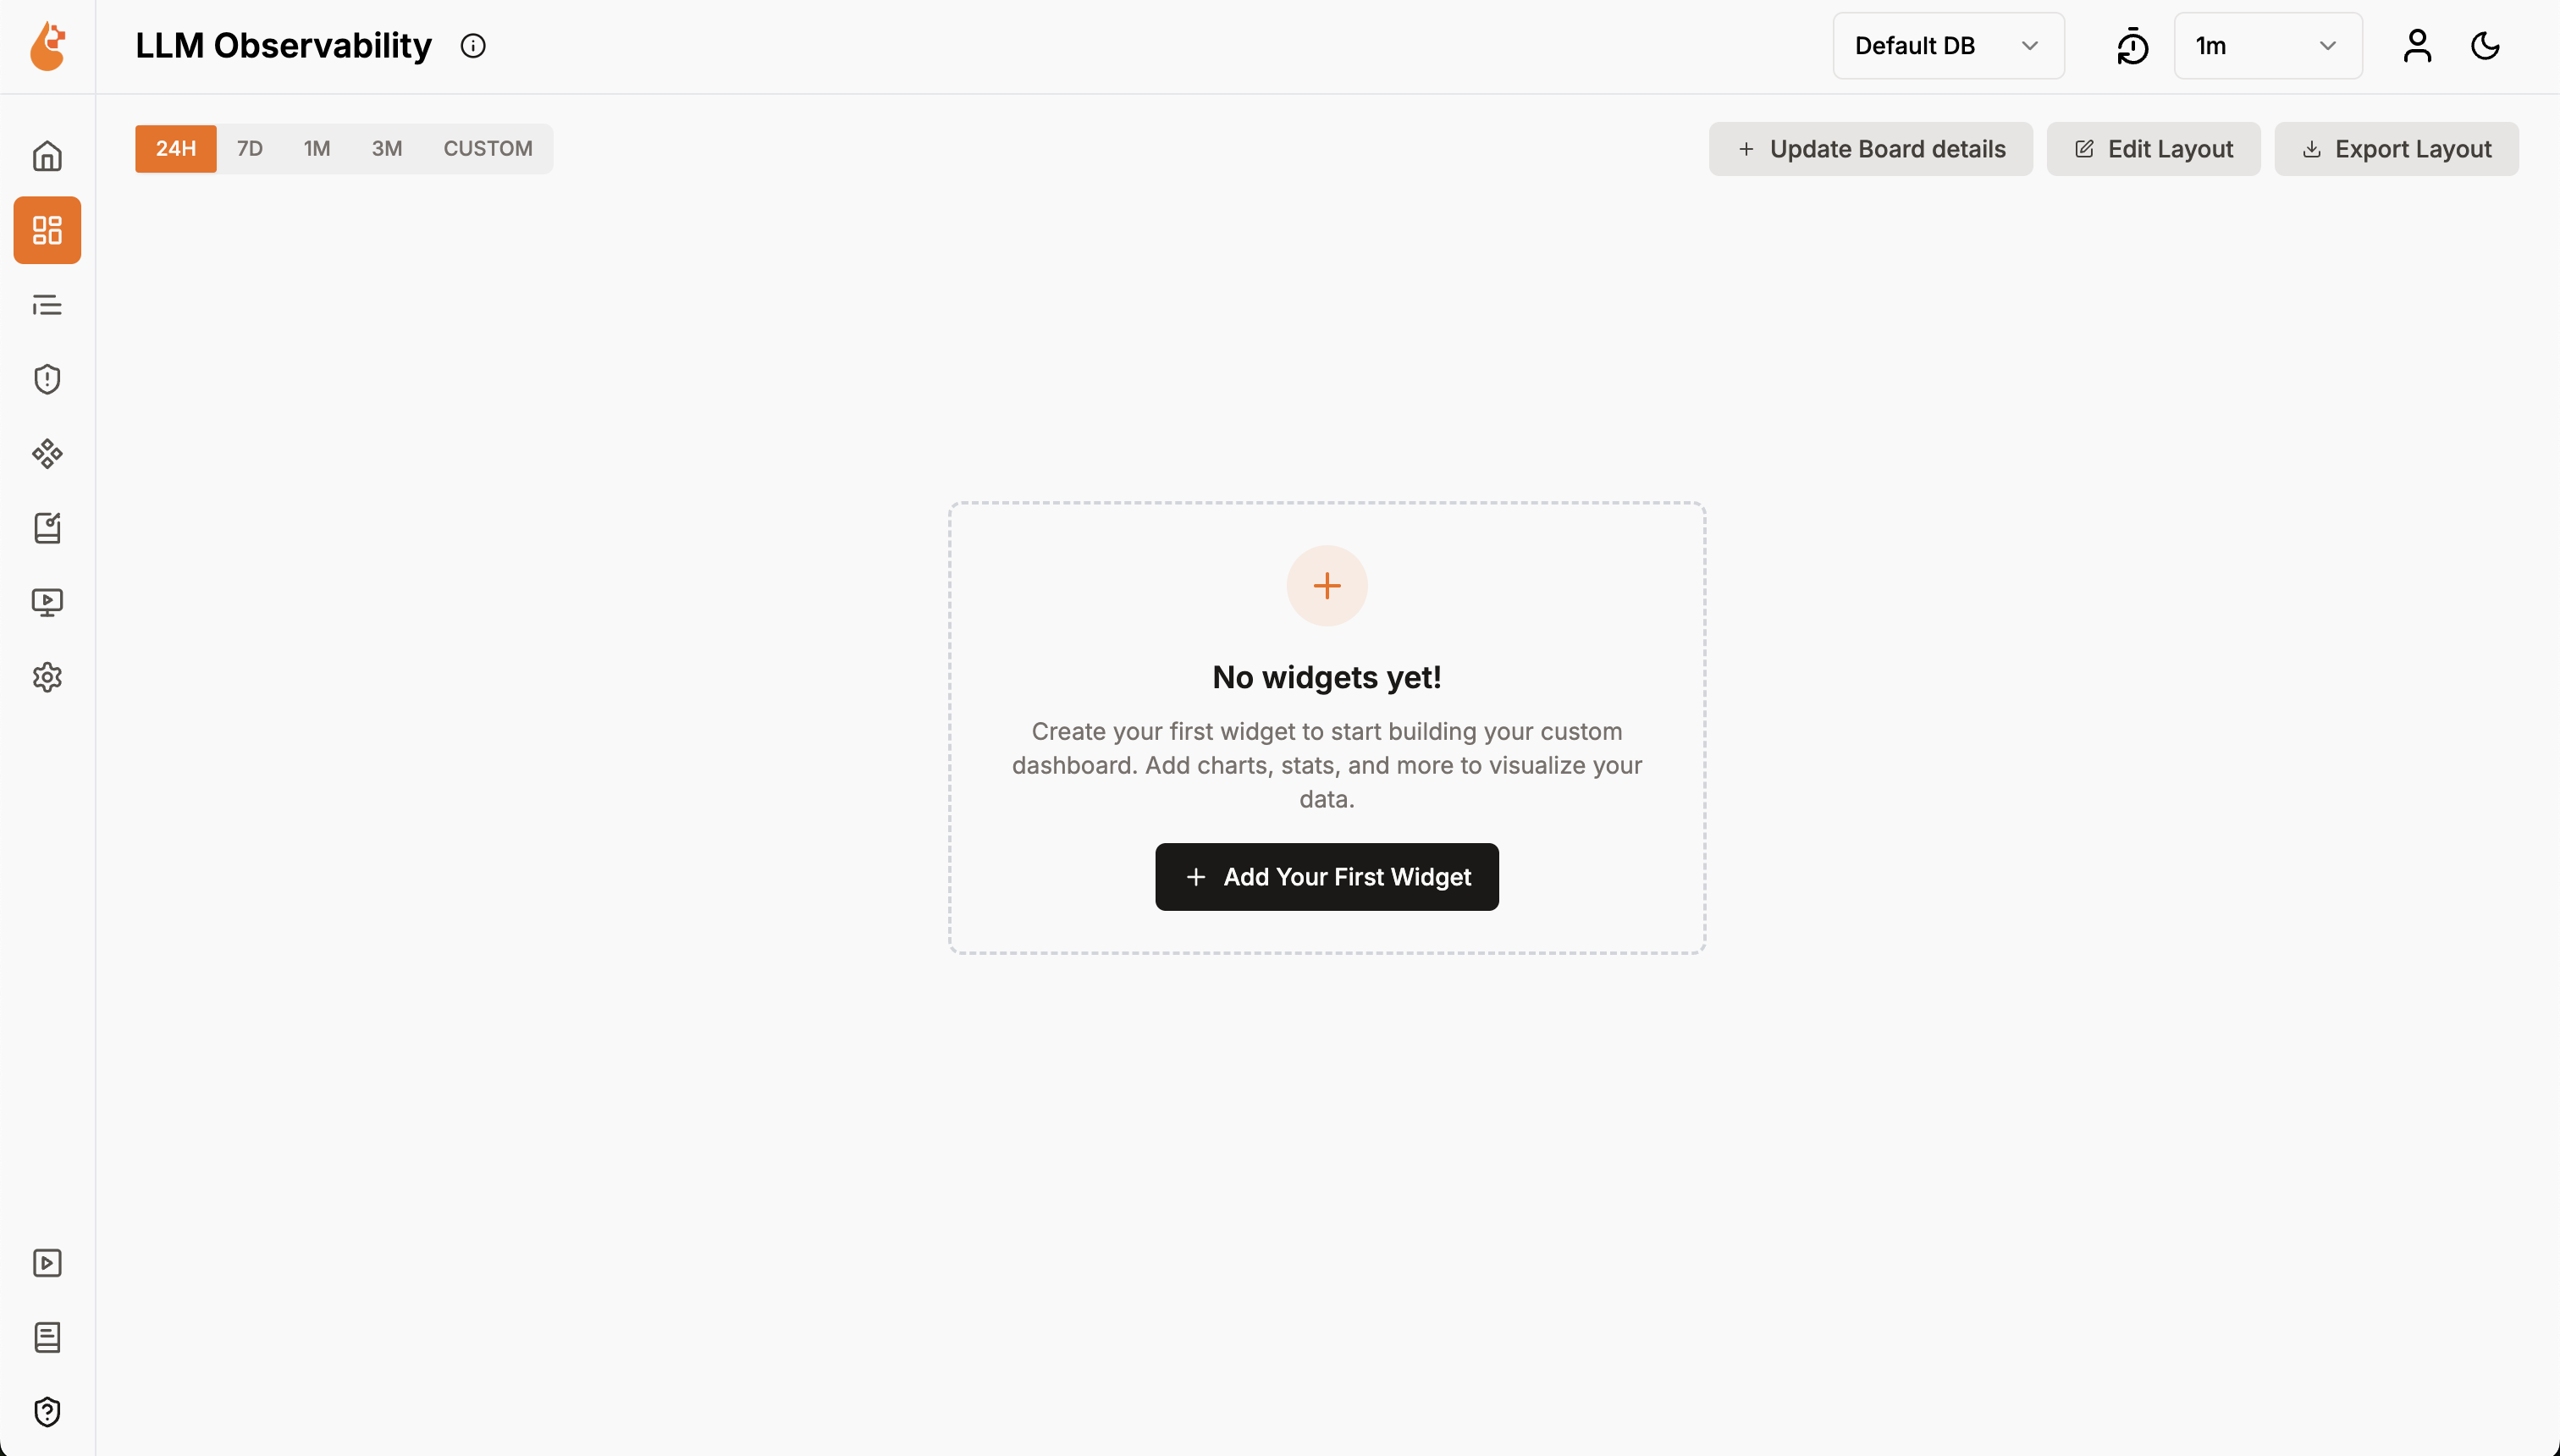
6. You'll be taken to the empty dashboard canvas ready for widgets
1. Click **Create Your First Widget** button on the empty dashboard
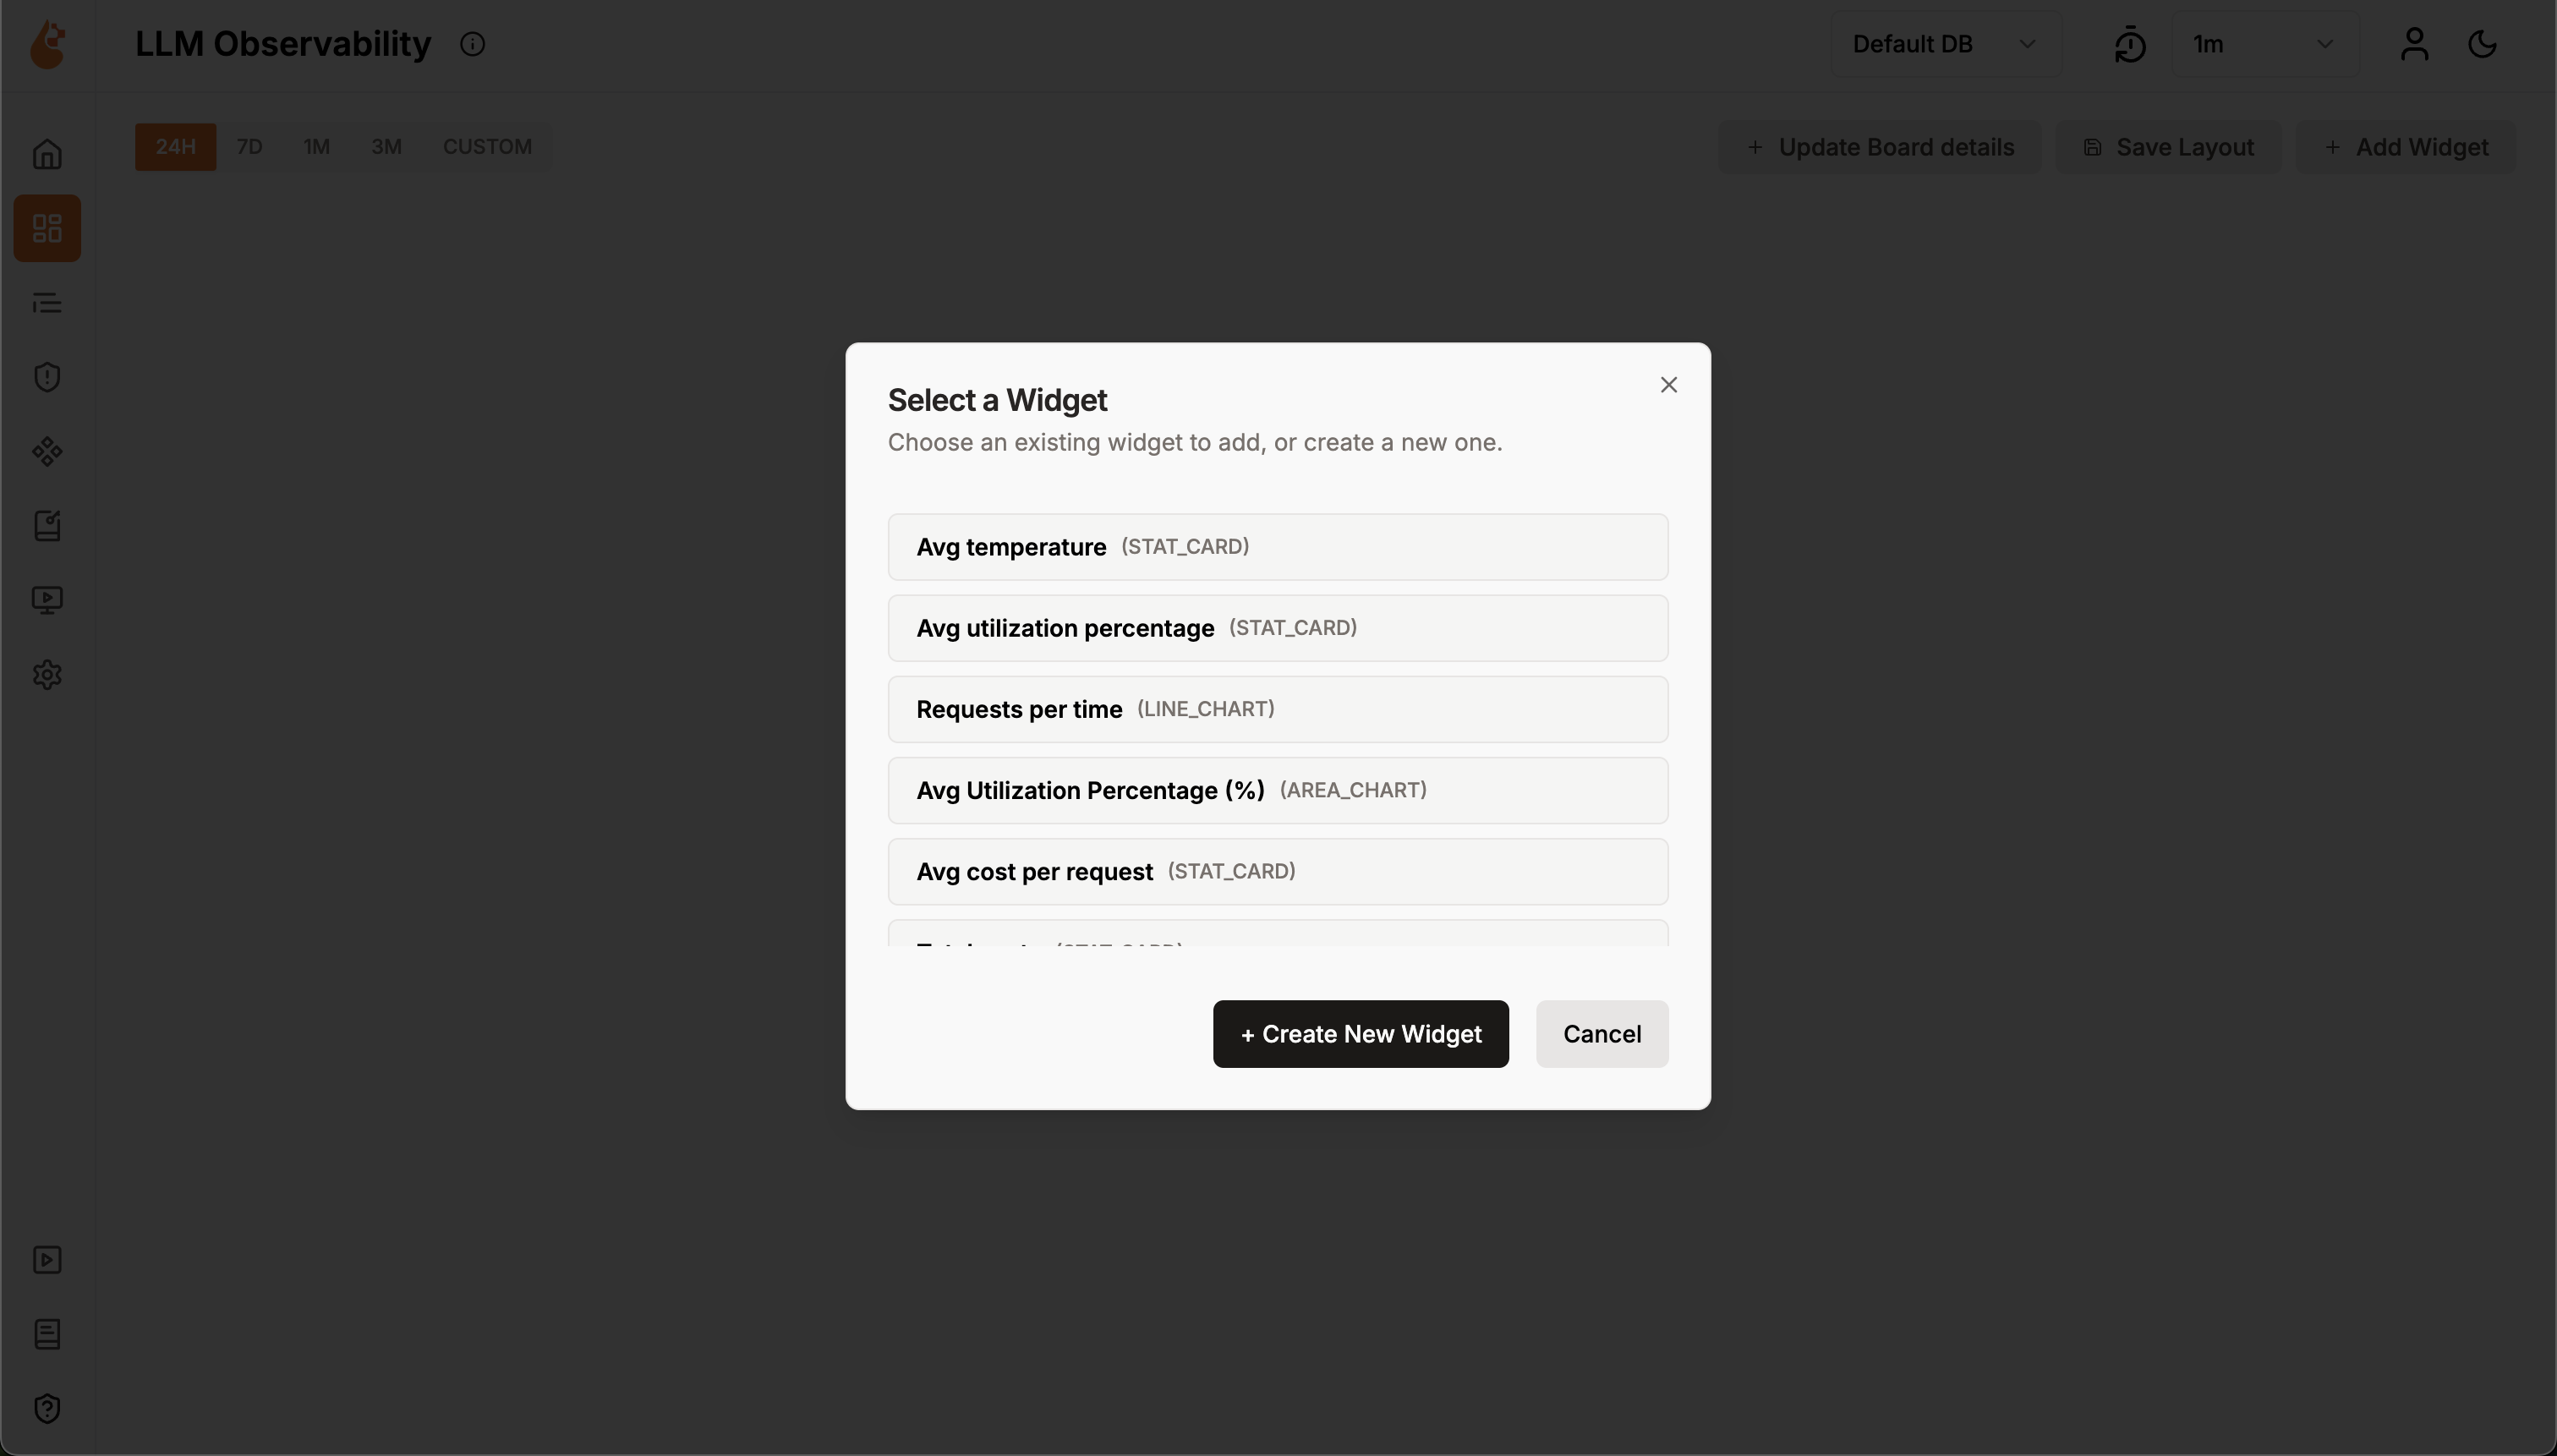
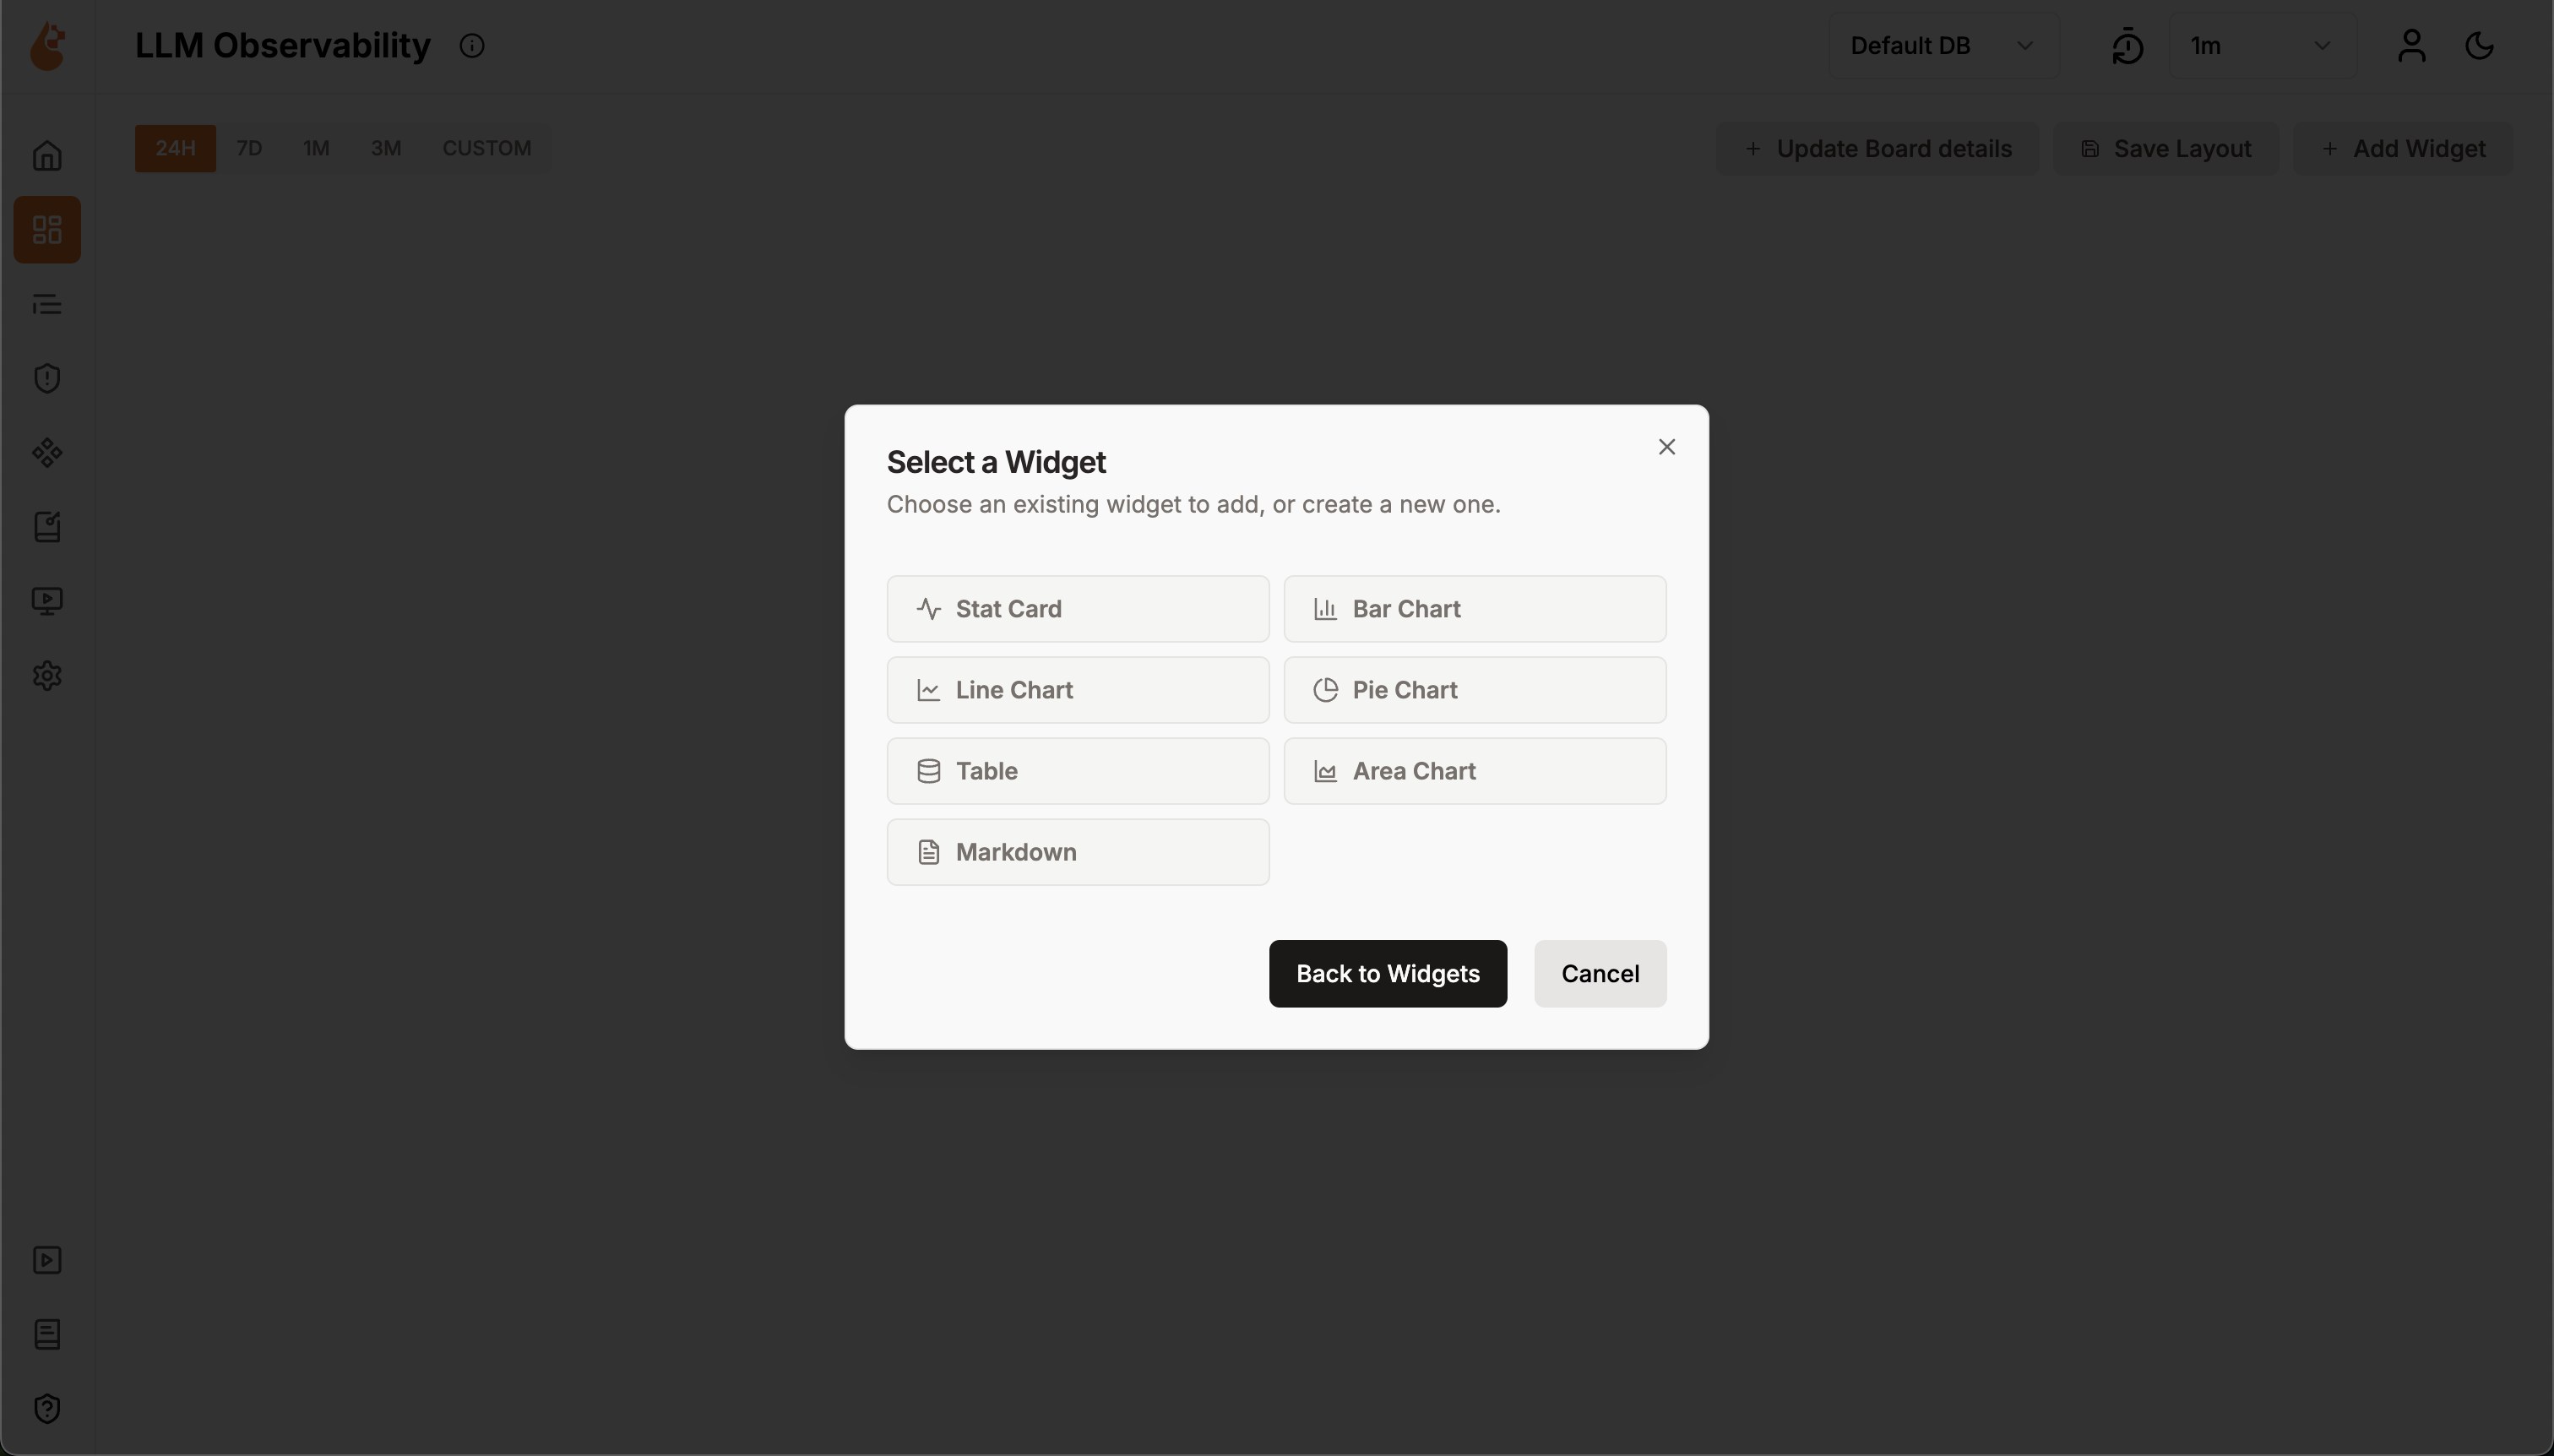
2. You'll see a **"Select a Widget"** popup with two options:
* **Choose from existing widgets**: Select from pre-built widgets like "Avg temperature", "Avg utilization percentage", "Requests per time", etc.
* **Create new widget**: Click **+ Create New Widget** to build a custom widget
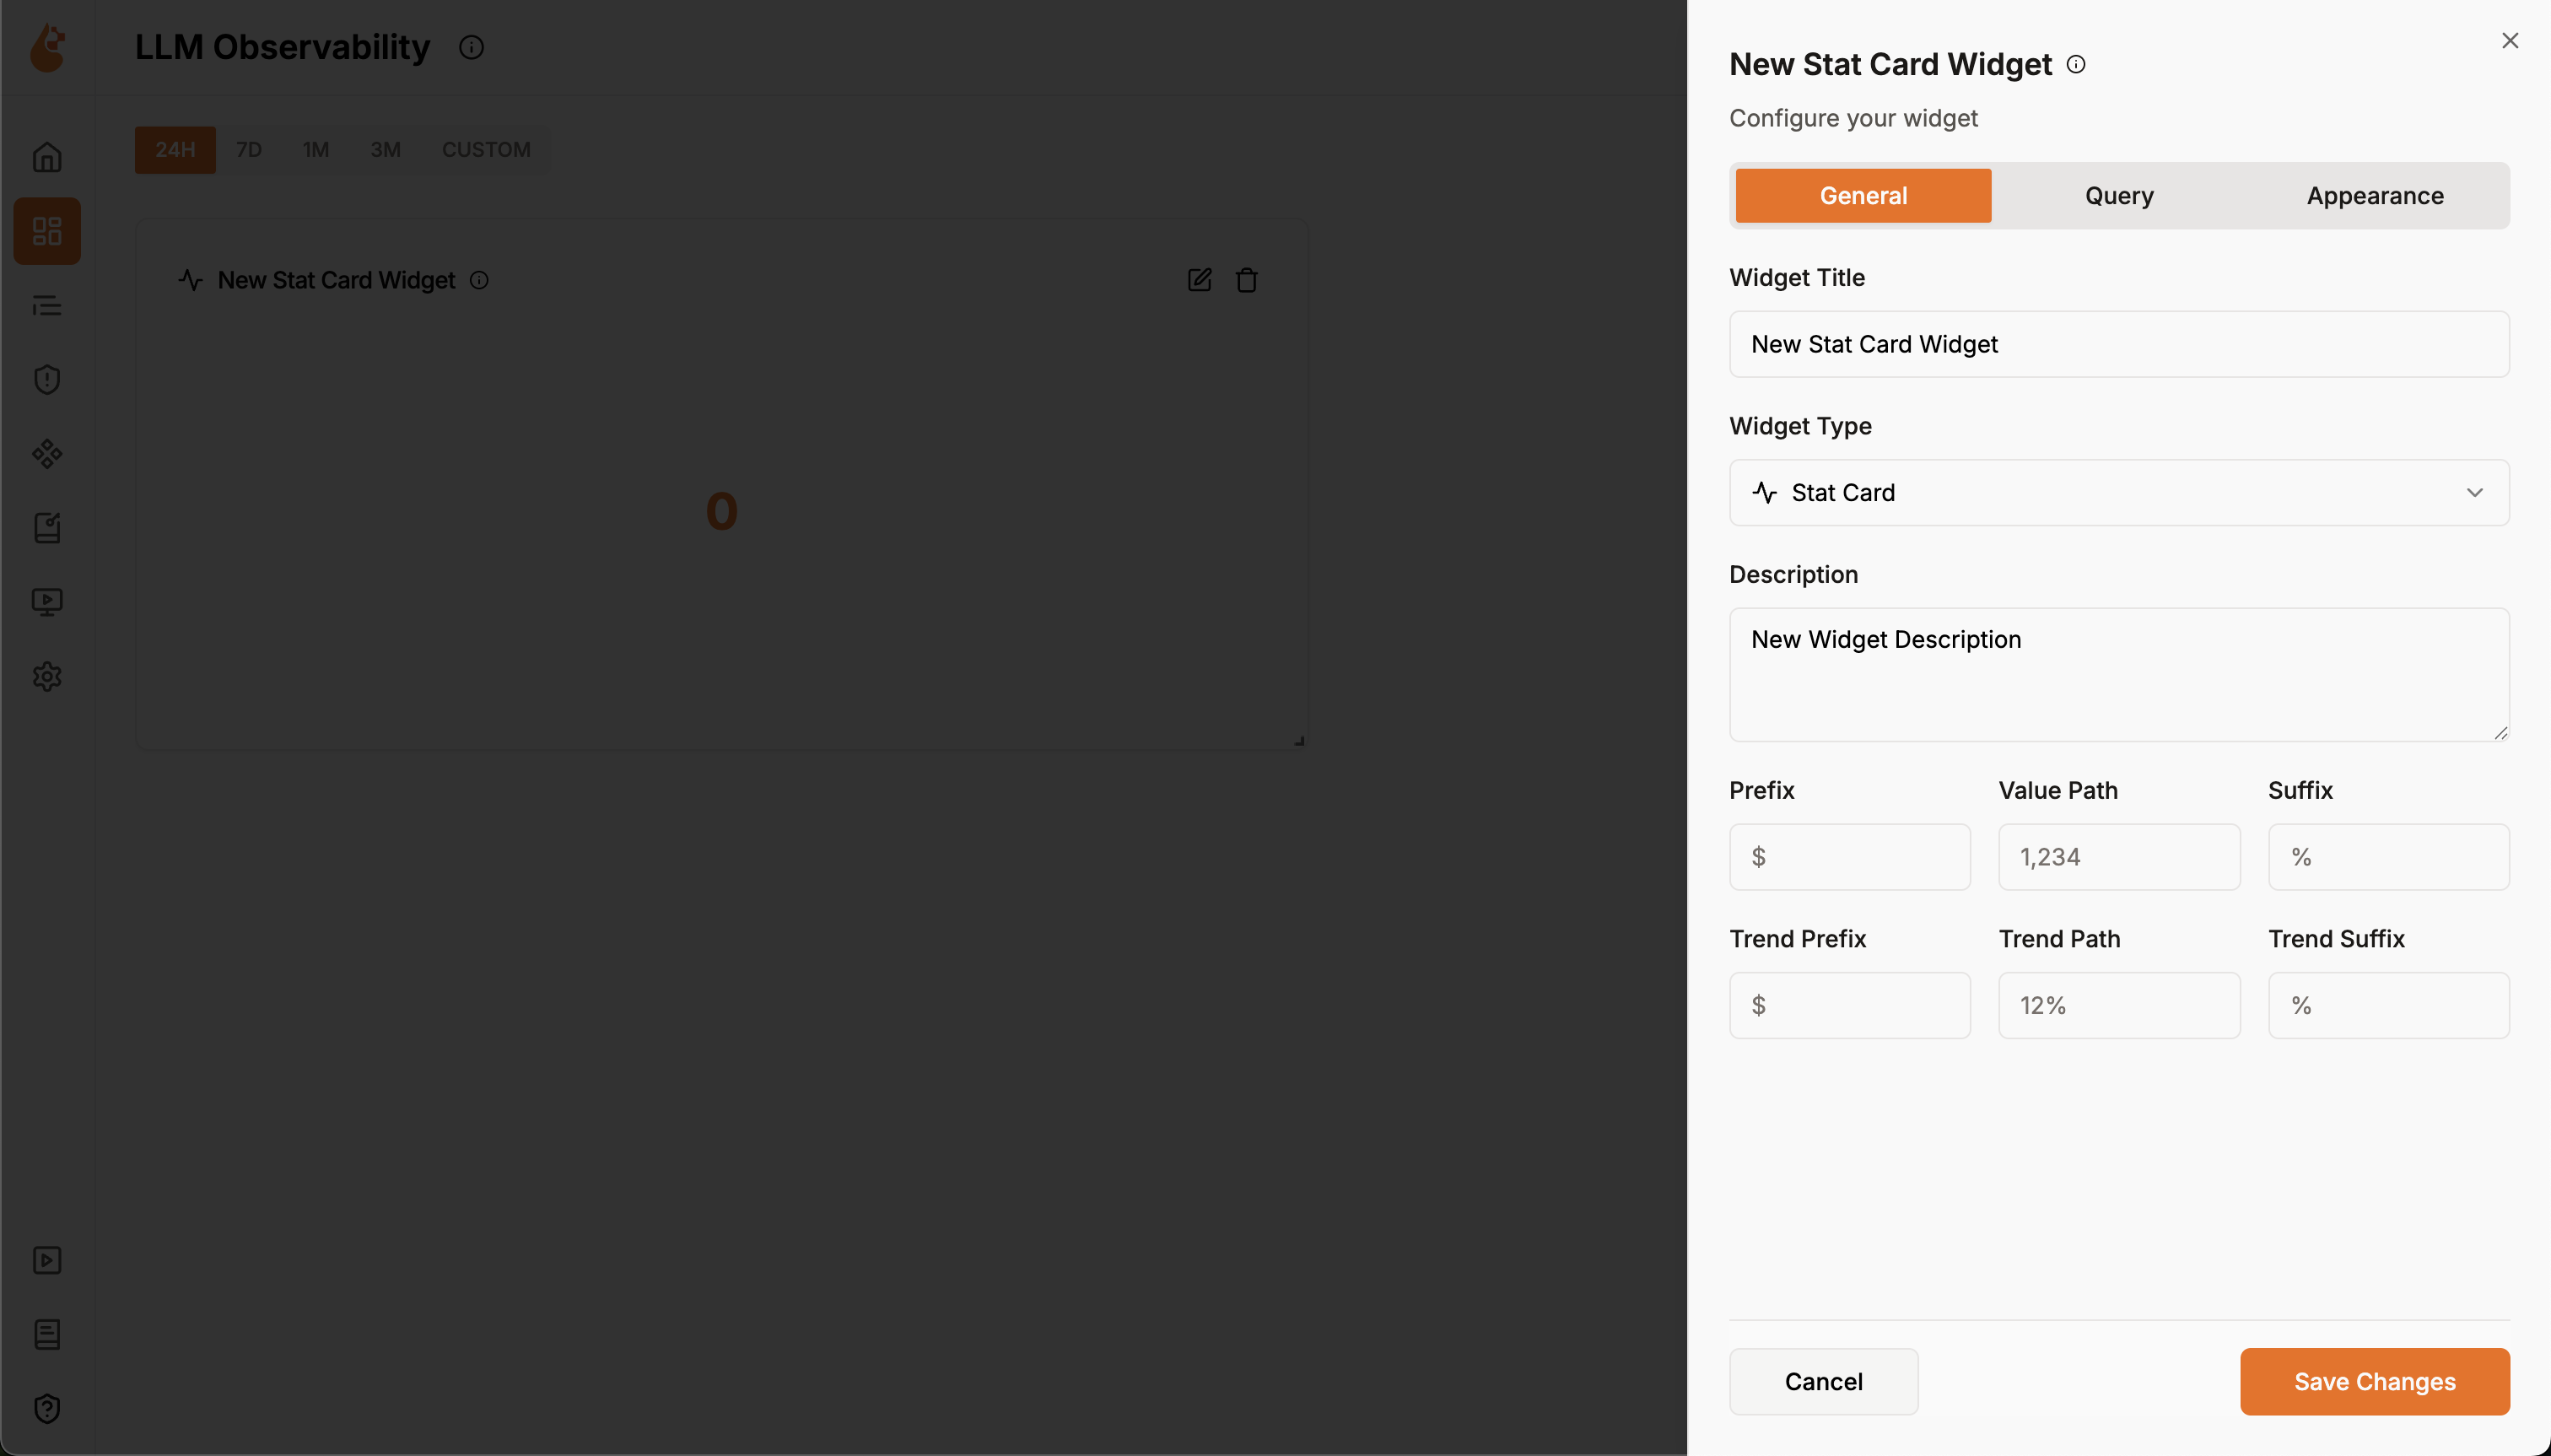
When creating a new widget, you'll see a configuration panel with three tabs:
**General Tab**
1. **Widget Title**: Enter a descriptive name (e.g., "Total Requests")
2. **Widget Type**: Select from **Stat Card** in this example
3. **Description**: Add context about what the widget shows
4. **Value Path**: Specify which field from your query to display (e.g., `0.count()` in this example)
5. **Prefix**: Add symbols before the value (e.g., `$` for costs)
6. **Suffix**: Add units after the value (e.g., `%` for percentages)
**Query Tab**
1. **Write your SQL query** against the ClickHouse database. For example:
```sql theme={null}
SELECT count(*) FROM otel_traces
```
2. **Test your query** by clicking **Run Query**
3. **Verify the results** - you'll see output like: `{"count()": 622}`
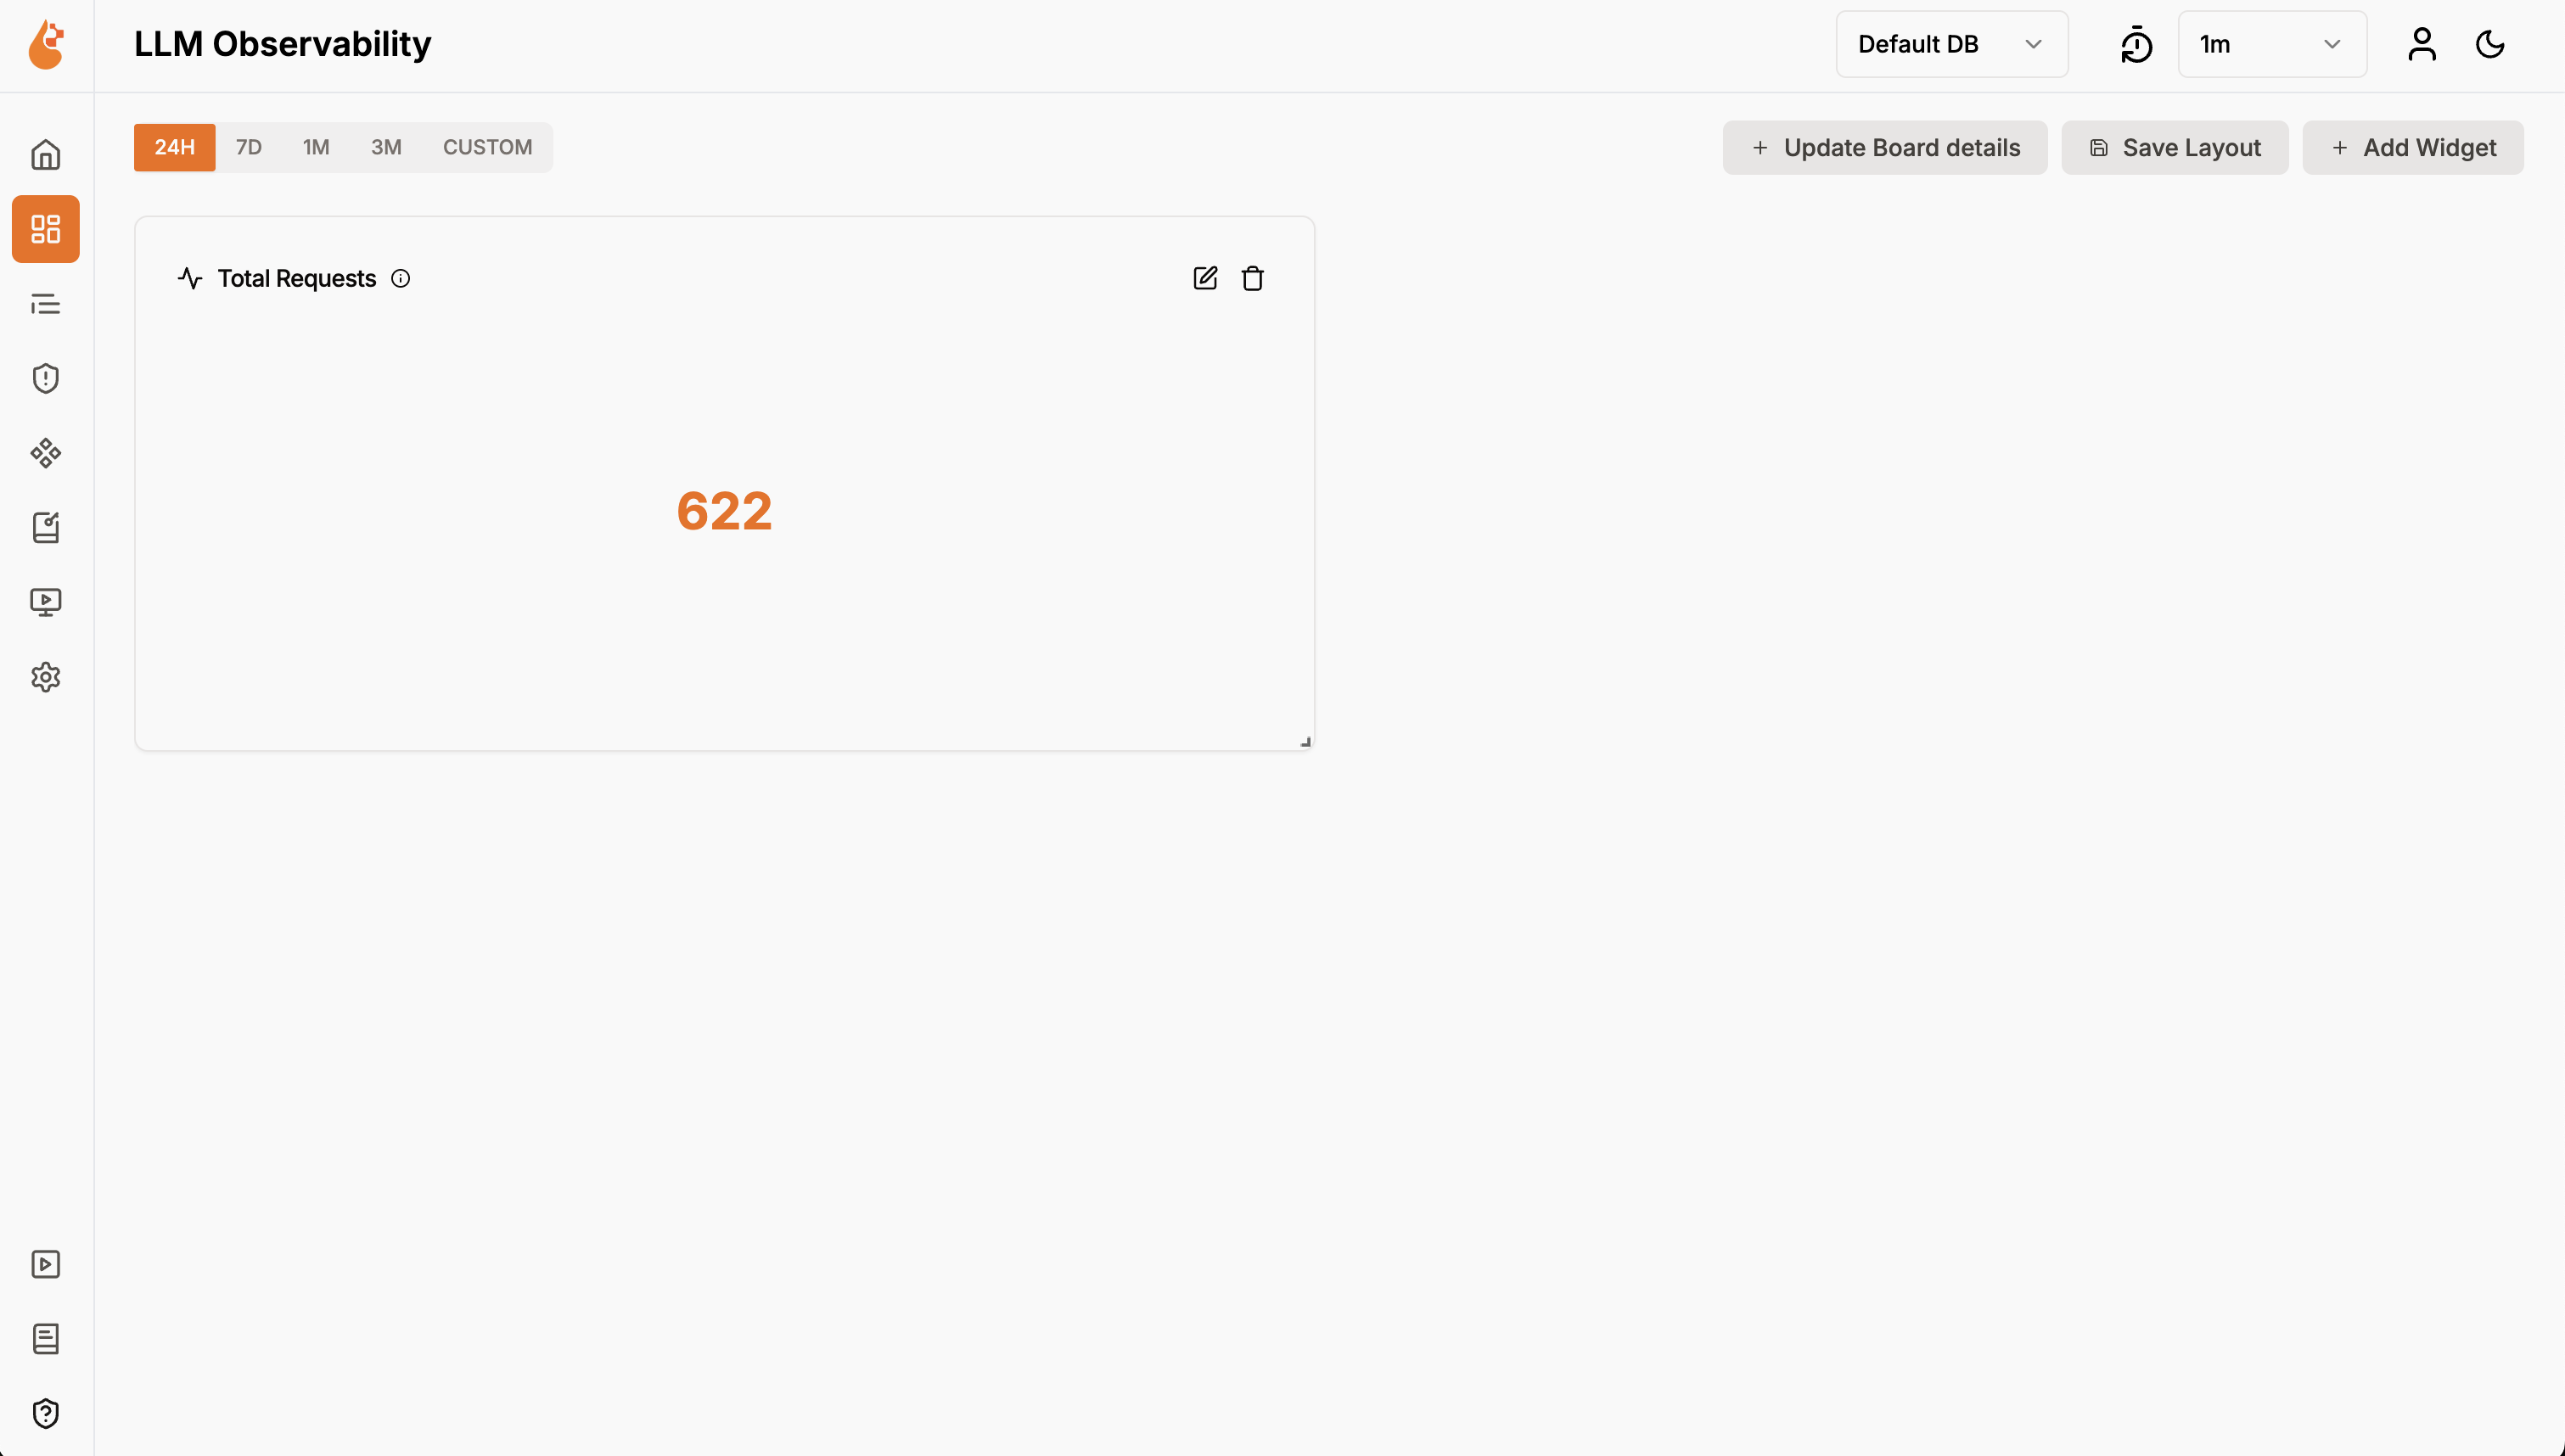
1. Click **Save Changes** to add the widget to your dashboard
2. The widget will appear on your dashboard canvas
3. You can immediately see your data visualization
* **Add more widgets**: Click **Create Widget** to add additional visualizations
* **Resize widgets**: Drag the corners of any widget to adjust its size
* **Move widgets**: Drag widgets to rearrange their positions on the dashboard
 1. Navigate to the **Dashboards** section in the main navigation
2. Click the **Create new dashboard** button in the top right corner
3. A **"Create a new dashboard or folder"** popup will appear
4. **Fill in the dashboard details**:
* **Name**: Enter a descriptive name (e.g., "LLM Observability")
* **Description**: Describe the dashboard's purpose (e.g., "Dashboard to view telemetry from LLM apps and AI Agents")
* **Tags**: Add relevant tags for organization and searchability
* **Type**: Select **Dashboard** (Dashboard with widgets)
5. Click the **Add** button to create your dashboard
6. You'll be taken to the empty dashboard canvas ready for widgets
1. Navigate to the **Dashboards** section in the main navigation
2. Click the **Create new dashboard** button in the top right corner
3. A **"Create a new dashboard or folder"** popup will appear
4. **Fill in the dashboard details**:
* **Name**: Enter a descriptive name (e.g., "LLM Observability")
* **Description**: Describe the dashboard's purpose (e.g., "Dashboard to view telemetry from LLM apps and AI Agents")
* **Tags**: Add relevant tags for organization and searchability
* **Type**: Select **Dashboard** (Dashboard with widgets)
5. Click the **Add** button to create your dashboard
6. You'll be taken to the empty dashboard canvas ready for widgets
 1. Click **Create Your First Widget** button on the empty dashboard
2. You'll see a **"Select a Widget"** popup with two options:
1. Click **Create Your First Widget** button on the empty dashboard
2. You'll see a **"Select a Widget"** popup with two options:
 * **Choose from existing widgets**: Select from pre-built widgets like "Avg temperature", "Avg utilization percentage", "Requests per time", etc.
* **Create new widget**: Click **+ Create New Widget** to build a custom widget
* **Choose from existing widgets**: Select from pre-built widgets like "Avg temperature", "Avg utilization percentage", "Requests per time", etc.
* **Create new widget**: Click **+ Create New Widget** to build a custom widget
 1. **Widget Title**: Enter a descriptive name (e.g., "Total Requests")
2. **Widget Type**: Select from **Stat Card** in this example
3. **Description**: Add context about what the widget shows
4. **Value Path**: Specify which field from your query to display (e.g., `0.count()` in this example)
5. **Prefix**: Add symbols before the value (e.g., `$` for costs)
6. **Suffix**: Add units after the value (e.g., `%` for percentages)
**Query Tab**
1. **Widget Title**: Enter a descriptive name (e.g., "Total Requests")
2. **Widget Type**: Select from **Stat Card** in this example
3. **Description**: Add context about what the widget shows
4. **Value Path**: Specify which field from your query to display (e.g., `0.count()` in this example)
5. **Prefix**: Add symbols before the value (e.g., `$` for costs)
6. **Suffix**: Add units after the value (e.g., `%` for percentages)
**Query Tab**
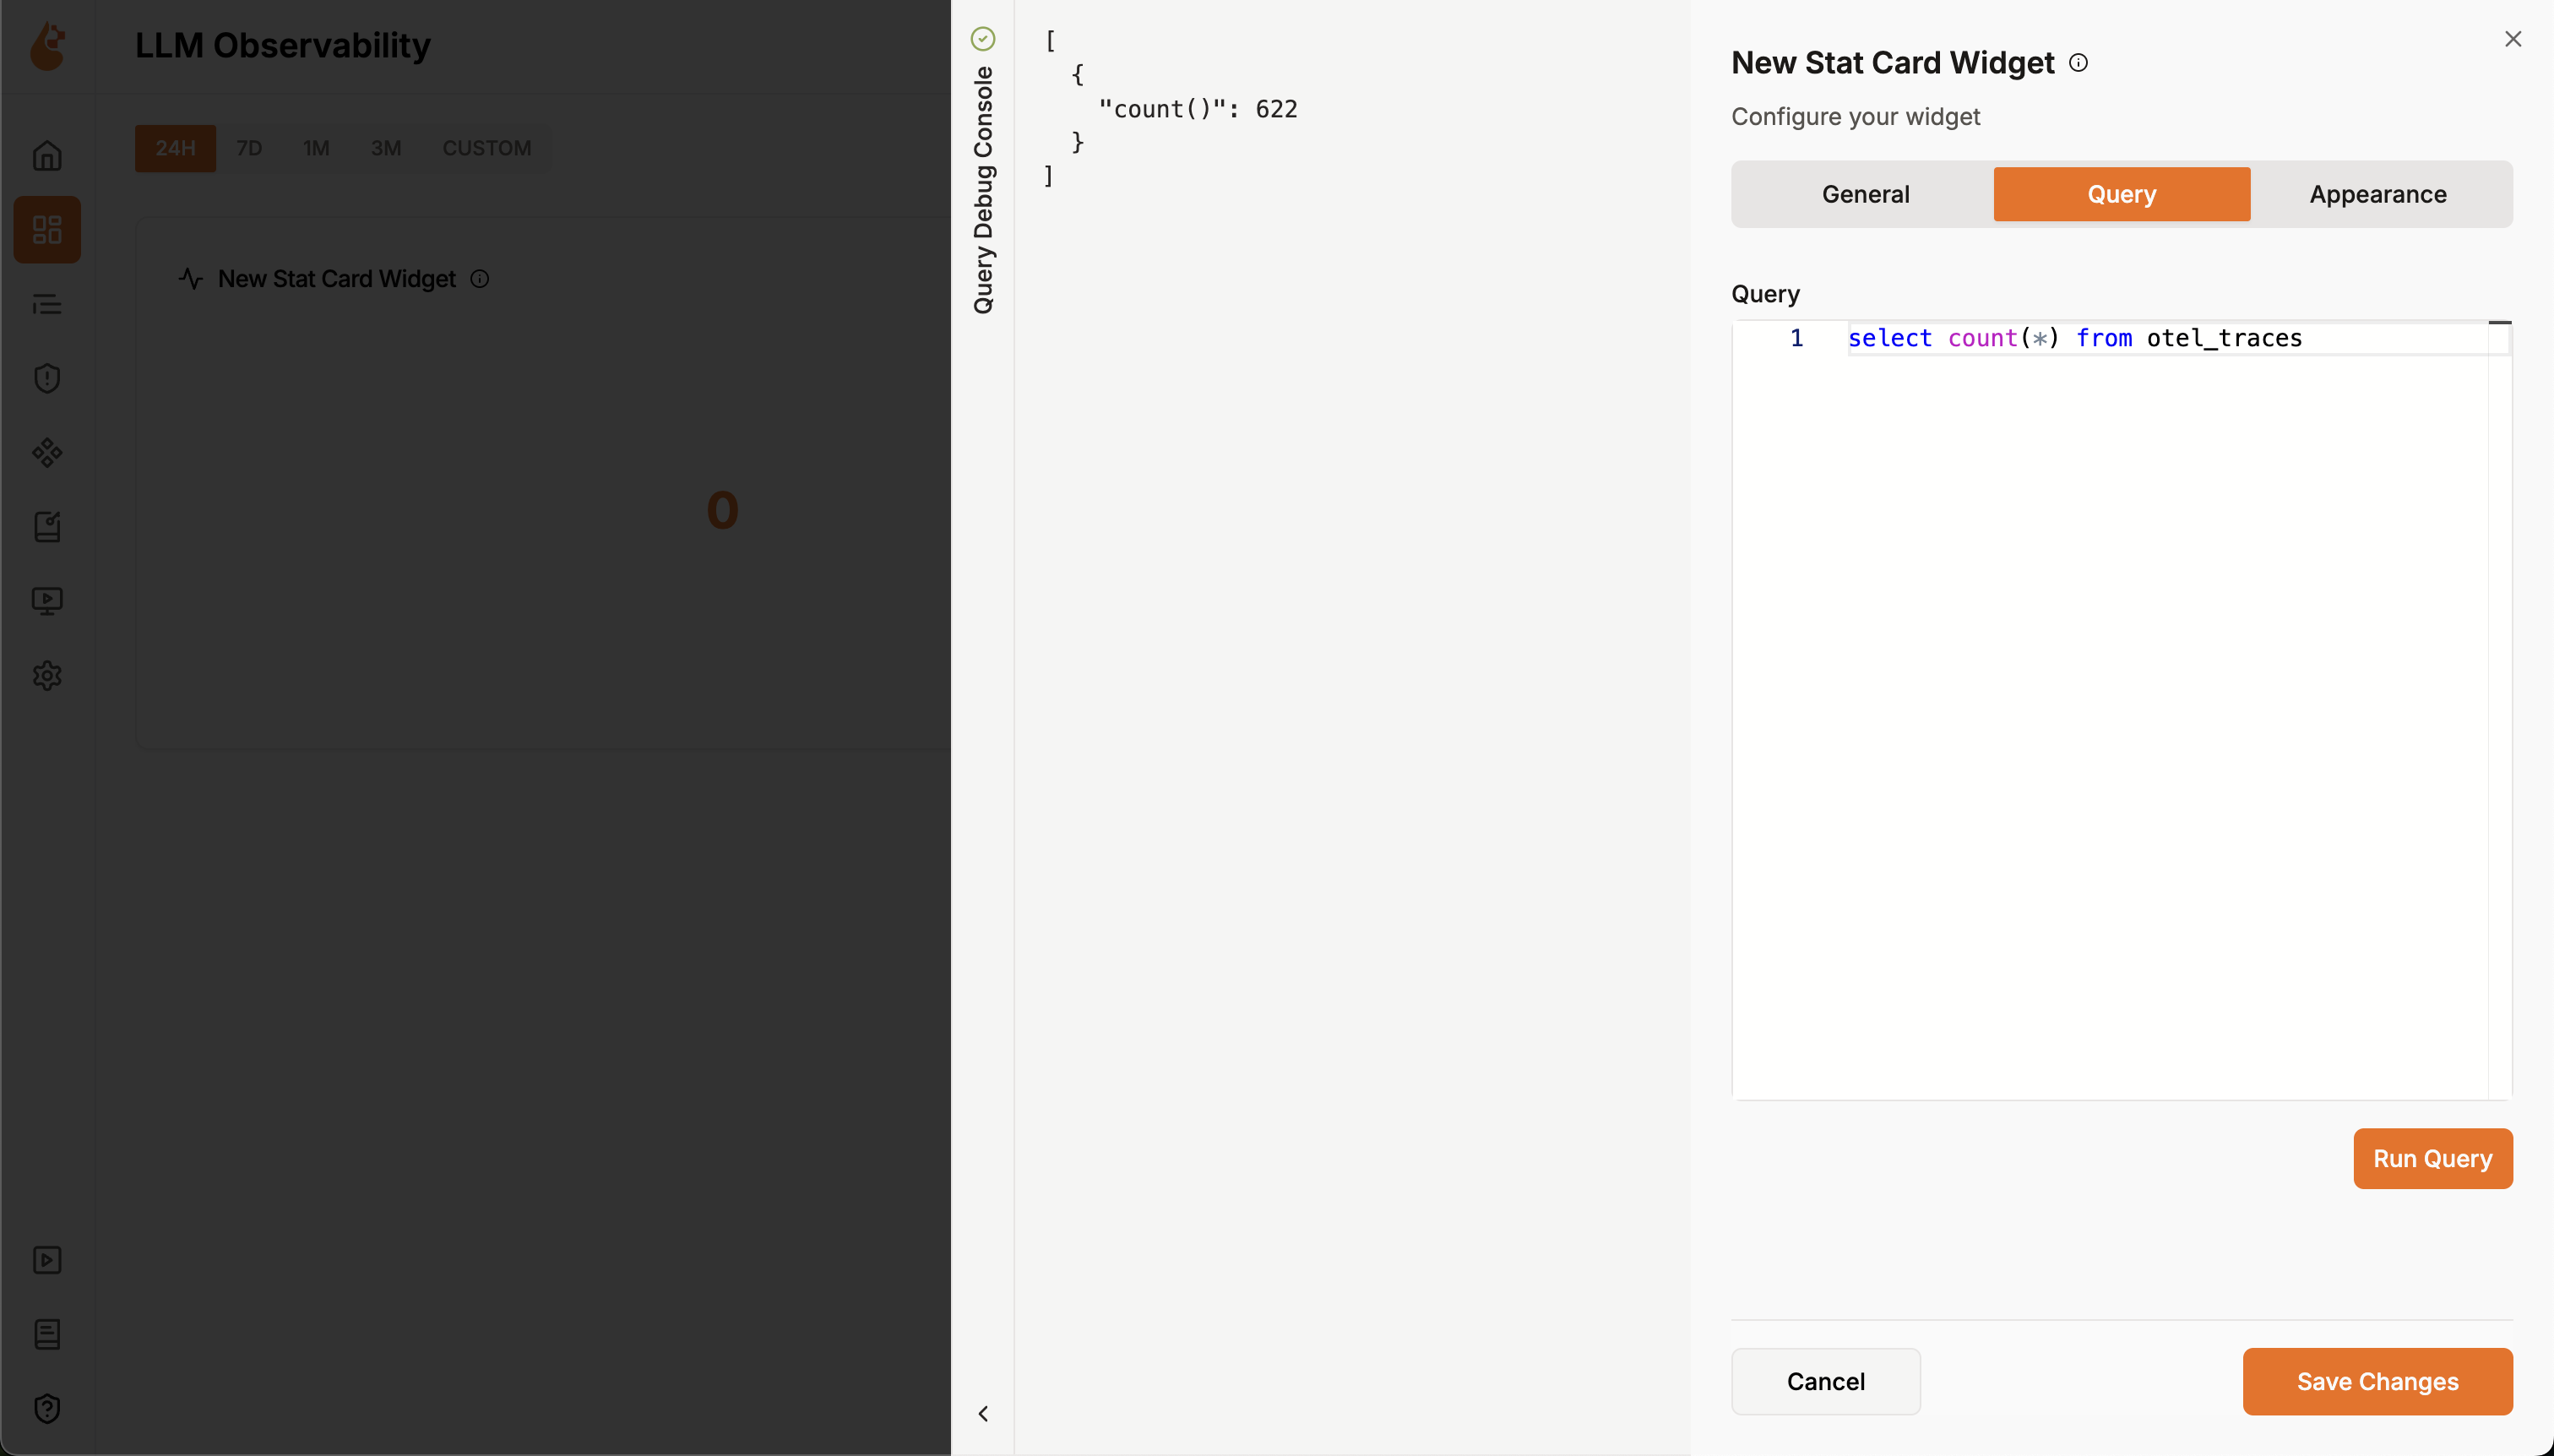 1. **Write your SQL query** against the ClickHouse database. For example:
```sql theme={null}
SELECT count(*) FROM otel_traces
```
2. **Test your query** by clicking **Run Query**
3. **Verify the results** - you'll see output like: `{"count()": 622}`
1. **Write your SQL query** against the ClickHouse database. For example:
```sql theme={null}
SELECT count(*) FROM otel_traces
```
2. **Test your query** by clicking **Run Query**
3. **Verify the results** - you'll see output like: `{"count()": 622}`